Tuesday, December 29, 2020

My 2021 cloud computing New Year’s resolutions

Typical New Year’s resolutions focus on personal and professional development—ways to improve. Although I certainly have personal goals of no interest to anyone but myself, I also have some related to the cloud computing profession. I’ll share them in hopes that a few of you will adopt these efforts as well. 

Teach more people about cloud computing. If you have followed me for some time, you understand that I have a passion for education. However, rather than focus on a traditional educational path where most of what you learn is useless, concentrate on specific cloud skills that are very marketable right now, such as storage, architecture, cloud-native databases, security, etc.  

To read this article in full, please click here

Tuesday, December 22, 2020

2 mistakes that will kill your multicloud project

Multicloud should be easy, right? I mean, it’s just deploying and managing more than a single public cloud. This has unfortunately not been the case. As more enterprises deploy multicloud architectures, some avoidable mistakes are happening over and over again. With a bit of understanding, perhaps you can avoid them. Let’s review the top two:

Not designing and building your multicloud with cloudops in mind. Many enterprises are deploying two, three, or sometimes more public clouds without a clear understanding of how this multicloud architecture will be managed long term.

When a multicloud deployment moves to production, there’s a great number of cloud services caused by leveraging multiple public clouds with redundant services (such as storage and compute). It all becomes too much for the cloudops team to deal with. They can’t operate all of these heterogenous cloud services as well as they should, and the quality of service suffers. It also places way too much risk on the deployment in terms of security and governance operations.

To read this article in full, please click here

Wednesday, December 16, 2020

Amazon Location – Add Maps and Location Awareness to Your Applications

We want to make it easier and more cost-effective for you to add maps, location awareness, and other location-based features to your web and mobile applications. Until now, doing this has been somewhat complex and expensive, and also tied you to the business and programming models of a single provider.

Introducing Amazon Location Service
Today we are making Amazon Location available in preview form and you can start using it today. Priced at a fraction of common alternatives, Amazon Location Service gives you access to maps and location-based services from multiple providers on an economical, pay-as-you-go basis.

You can use Amazon Location Service to build applications that know where they are and respond accordingly. You can display maps, validate addresses, perform geocoding (turn an address into a location), track the movement of packages and devices, and much more. You can easily set up geofences and receive notifications when tracked items enter or leave a geofenced area. You can even overlay your own data on the map while retaining full control.

You can access Amazon Location Service from the AWS Management Console, AWS Command Line Interface (CLI), or via a set of APIs. You can also use existing map libraries such as Mapbox GL and Tangram.

All About Amazon Location
Let’s take a look at the types of resources that Amazon Location Service makes available to you, and then talk about how you can use them in your applications.

MapsAmazon Location Service lets you create maps that make use of data from our partners. You can choose between maps and map styles provided by Esri and by HERE Technologies, with the potential for more maps & more styles from these and other partners in the future. After you create a map, you can retrieve a tile (at one of up to 16 zoom levels) using the GetMapTile function. You won’t do this directly, but will use Mapbox GL, Tangram, or another library instead.

Place Indexes – You can choose between indexes provided by Esri and HERE. The indexes support the SearchPlaceIndexForPosition function which returns places, such as residential addresses or points of interest (often known as POI) that are closest to the position that you supply, while also performing reverse geocoding to turn the position (a pair of coordinates) into a legible address. Indexes also support the SearchPlaceIndexForText function, which searches for addresses, businesses, and points of interest using free-form text such as an address, a name, a city, or a region.

Trackers –Trackers receive location updates from one or more devices via the BatchUpdateDevicePosition function, and can be queried for the current position (GetDevicePosition) or location history (GetDevicePositionHistory) of a device. Trackers can also be linked to Geofence Collections to implement monitoring of devices as they move in and out of geofences.

Geofence Collections – Each collection contains a list of geofences that define geographic boundaries. Here’s a geofence (created with geojson.io) that outlines a park near me:

Amazon Location in Action
I can use the AWS Management Console to get started with Amazon Location and then move on to the AWS Command Line Interface (CLI) or the APIs if necessary. I open the Amazon Location Service Console, and I can either click Try it! to create a set of starter resources, or I can open up the navigation on the left and create them one-by-one. I’ll go for one-by-one, and click Maps:

Then I click Create map to proceed:

I enter a Name and a Description:

Then I choose the desired map and click Create map:

The map is created and ready to be added to my application right away:

Now I am ready to embed the map in my application, and I have several options including the Amplify JavaScript SDK, the Amplify Android SDK, the Amplify iOS SDK, Tangram, and Mapbox GL (read the Developer Guide to learn more about each option).

Next, I want to track the position of devices so that I can be notified when they enter or exit a given region. I use a GeoJSON editing tool such as geojson.io to create a geofence that is built from polygons, and save (download) the resulting file:

I click Create geofence collection in the left-side navigation, and in Step 1, I add my GeoJSON file, enter a Name and Description, and click Next:

Now I enter a Name and a Description for my tracker, and click Next. It will be linked to the geofence collection that I just created:

The next step is to arrange for the tracker to send events to Amazon EventBridge so that I can monitor them in CloudWatch Logs. I leave the settings as-is, and click Next to proceed:

I review all of my choices, and click Finalize to move ahead:

The resources are created, set up, and ready to go:

I can then write code or use the CLI to update the positions of my devices:

$ aws location batch-update-device-position \
   --tracker-name MyTracker1 \
   --updates "DeviceId=Jeff1,Position=-122.33805,47.62748,SampleTime=2020-11-05T02:59:07+0000"

After I do this a time or two, I can retrieve the position history for the device:

$ aws location get-device-position-history \
  -tracker-name MyTracker1 --device-id Jeff1
------------------------------------------------
|           GetDevicePositionHistory           |
+----------------------------------------------+
||               DevicePositions              ||
|+---------------+----------------------------+|
||  DeviceId     |  Jeff1                     ||
||  ReceivedTime |  2020-11-05T02:59:17.246Z  ||
||  SampleTime   |  2020-11-05T02:59:07Z      ||
|+---------------+----------------------------+|
|||                 Position                 |||
||+------------------------------------------+||
|||  -122.33805                              |||
|||  47.62748                                |||
||+------------------------------------------+||
||               DevicePositions              ||
|+---------------+----------------------------+|
||  DeviceId     |  Jeff1                     ||
||  ReceivedTime |  2020-11-05T03:02:08.002Z  ||
||  SampleTime   |  2020-11-05T03:01:29Z      ||
|+---------------+----------------------------+|
|||                 Position                 |||
||+------------------------------------------+||
|||  -122.43805                              |||
|||  47.52748                                |||
||+------------------------------------------+||

I can write Amazon EventBridge rules that watch for the events, and use them to perform any desired processing. Events are published when a device enters or leaves a geofenced area, and look like this:

{
  "version": "0",
  "id": "7cb6afa8-cbf0-e1d9-e585-fd5169025ee0",
  "detail-type": "Location Geofence Event",
  "source": "aws.geo",
  "account": "123456789012",
  "time": "2020-11-05T02:59:17.246Z",
  "region": "us-east-1",
  "resources": [
    "arn:aws:geo:us-east-1:123456789012:geofence-collection/MyGeoFences1",
    "arn:aws:geo:us-east-1:123456789012:tracker/MyTracker1"
  ],
  "detail": {
        "EventType": "ENTER",
        "GeofenceId": "LakeUnionPark",
        "DeviceId": "Jeff1",
        "SampleTime": "2020-11-05T02:59:07Z",
        "Position": [-122.33805, 47.52748]
  }
}

Finally, I can create and use place indexes so that I can work with geographical objects. I’ll use the CLI for a change of pace. I create the index:

$ aws location create-place-index \
  --index-name MyIndex1 --data-source Here

Then I query it to find the addresses and points of interest near the location:

$ aws location search-place-index-for-position --index-name MyIndex1 \
  --position "[-122.33805,47.62748]" --output json \
  |  jq .Results[].Place.Label
"Terry Ave N, Seattle, WA 98109, United States"
"900 Westlake Ave N, Seattle, WA 98109-3523, United States"
"851 Terry Ave N, Seattle, WA 98109-4348, United States"
"860 Terry Ave N, Seattle, WA 98109-4330, United States"
"Seattle Fireboat Duwamish, 860 Terry Ave N, Seattle, WA 98109-4330, United States"
"824 Terry Ave N, Seattle, WA 98109-4330, United States"
"9th Ave N, Seattle, WA 98109, United States"
...

I can also do a text-based search:

$ aws location search-place-index-for-text --index-name MyIndex1 \
  --text Coffee --bias-position "[-122.33805,47.62748]" \
  --output json | jq .Results[].Place.Label
"Mohai Cafe, 860 Terry Ave N, Seattle, WA 98109, United States"
"Starbucks, 1200 Westlake Ave N, Seattle, WA 98109, United States"
"Metropolitan Deli and Cafe, 903 Dexter Ave N, Seattle, WA 98109, United States"
"Top Pot Doughnuts, 590 Terry Ave N, Seattle, WA 98109, United States"
"Caffe Umbria, 1201 Westlake Ave N, Seattle, WA 98109, United States"
"Starbucks, 515 Westlake Ave N, Seattle, WA 98109, United States"
"Cafe 815 Mercer, 815 9th Ave N, Seattle, WA 98109, United States"
"Victrola Coffee Roasters, 500 Boren Ave N, Seattle, WA 98109, United States"
"Specialty's, 520 Terry Ave N, Seattle, WA 98109, United States"
...

Both of the searches have other options; read the Geocoding, Reverse Geocoding, and Search to learn more.

Things to Know
Amazon Location is launching today as a preview, and you can get started with it right away. During the preview we plan to add an API for routing, and will also do our best to respond to customer feedback and feature requests as they arrive.

Pricing is based on usage, with an initial evaluation period that lasts for three months and lets you make numerous calls to the Amazon Location APIs at no charge. After the evaluation period you pay the prices listed on the Amazon Location Pricing page.

Amazon Location is available in the US East (N. Virginia), US East (Ohio), US West (Oregon), Europe (Ireland), and Asia Pacific (Tokyo) Regions.

Jeff;


Via AWS News Blog https://ift.tt/1EusYcK

Tuesday, December 15, 2020

New –  FreeRTOS Long Term Support to Provide Years of Feature Stability

Today, I’m particularly happy to announce FreeRTOS Long Term Support (LTS). FreeRTOS is an open source, real-time operating system for microcontrollers that makes small, low-power edge devices easy to program, deploy, secure, connect, and manage. LTS releases offer a more stable foundation than standard releases as manufacturers deploy and later update devices in the field. As we have planned, LTS is now included in the FreeRTOS kernel and a set of FreeRTOS libraries needed for embedded and IoT applications, and for securely connecting microcontroller-based (MCU) devices to the cloud.

Embedded developers at original equipment manufacturers (OEMs) and MCU vendors using FreeRTOS to build long-lived applications on IoT devices now get the predictability and feature stability of an LTS release without compromising access to critical security updates. The FreeRTOS 202012.00 LTS release applies to the FreeRTOS kernel, connectivity libraries (FreeRTOS+TCP, coreMQTT, coreHTTP), security library (PKCS #11 implementation), and AWS library (AWS IoT Device Shadow).

We will provide security updates and critical bug fixes for all these libraries until December 31, 2022.

Benefits of FreeRTOS LTS
Embedded developers at OEMs who want to use FreeRTOS libraries for their long-lived applications want to benefit from security updates and bug fixes in the latest FreeRTOS mainline releases. Mainline releases can introduce both new features and critical fixes, which may increase time and effort for users to include only fixes.

An LTS release provides years of feature stability of included libraries. With an LTS release, any update will not change public APIs, file structure, or build processes that could require changes to your application. Security updates and critical bug fixes will be backported at least until Dec 31, 2022. LTS releases contain updates that only address critical issues including security vulnerabilities. Therefore, the integration of LTS releases is less disruptive to customers’ development and integration efforts as they approach and move into production. For MCU vendors, this means reduced effort in integrating a stable code base and faster time to market with vendors’ latest libraries.

Available Now
The FreeRTOS 202012.00 LTS release is available now to download. To learn more, visit FreeRTOS LTS and the documentation. Please send us feedback on the Github repository and the forum of FreeRTOS.

Channy

Via AWS News Blog https://ift.tt/1EusYcK

Announcing AWS IoT Greengrass 2.0 – With an Open Source Edge Runtime and New Developer Capabilities

I am happy to announce AWS IoT Greengrass 2.0, a new version of AWS IoT Greengrass that makes it easy for device builders to build, deploy, and manage intelligent device software. AWS IoT Greengrass 2.0 provides an open source edge runtime, a rich set of pre-built software components, tools for local software development, and new features for managing software on large fleets of devices.

AWS IoT Greengrass 2.0 edge runtime is now open source under an Apache 2.0 license, and available on Github. Access to the source code allows you to more easily integrate your applications, troubleshoot problems, and build more reliable and performant applications that use AWS IoT Greengrass.

You can add or remove pre-built software components based on your IoT use case and your device’s CPU and memory resources. For example, you can choose to include pre-built AWS IoT Greengrass components such as stream manager only when you need to process data streams with your application, or machine learning components only when you want to perform machine learning inference locally on your devices.

The AWS IoT Greengrass IoT Greengrass 2.0 includes a new command-line interface (CLI) that allows you to locally develop and debug applications on your device. In addition, there is a new local debug console that helps you visually debug applications on your device. With these new capabilities, you can rapidly develop and debug code on a test device before using the cloud to deploy to your production devices.

AWS IoT Greengrass 2.0 is also integrated with AWS IoT thing groups, enabling you to easily organize your devices in groups and manage application deployments across your devices with features to control rollout rates, timeouts, and rollbacks.

AWS IoT Greengrass 2.0 – Getting Started
Device builders can use AWS IoT Greengrass 2.0 by going to the AWS IoT Greengrass console where you can find a download and install command that you run on your device. Once the installer is downloaded to the device, you can use it to install Greengrass software with all essential features, register the device as an AWS IoT Thing, and create a simple “hello world” software component in less than 10 minutes.

To get started in the AWS IoT Greengrass console, you first register a test device by clicking Set up core device. You assign the name and group of your core device. To deploy to only the core device, select No group. In the next step, install the AWS IoT Greengrass Core software in your device.

When the installer completes, you can find your device in the list of AWS IoT Greengrass Core devices on the Core devices page.

AWS IoT Greengrass components enable you to develop and deploy software to your AWS IoT Greengrass Core devices. You can write your application functionality and bundle it as a private component for deployment. AWS IoT Greengrass also provides public components, which provide pre-built software for common use cases that you can deploy to your devices as you develop your device software. When you finish developing the software for your component, you can register it with AWS IoT Greengrass. Then, you can deploy and run the component on your AWS IoT Greengrass Core devices.

To create a component, click the Create component button on the Components page. You can use a recipe or import an AWS Lambda function. The component recipe is a YAML or JSON file that defines the component’s details, dependencies, compatibility, and lifecycle. To learn about the specifications, visit the recipe reference guide.

Here is an example of a YAML recipe.

When you finish developing your component, you can add it to a deployment configuration to deploy to one or more core devices. To create a new deployment or configure the components to deploy to core devices, click the Create button on the Deployments page. You can deploy to a core device or a thing group as a target, and select the components to deploy. The deployment includes the dependencies for each component that you select.

You can edit the version and parameters of selected components and advanced settings such as the rollout configuration, which defines the rate at which the configuration deploys to the target devices; timeout configuration, which defines the duration that each device has to apply the deployment; or cancel configuration, which defines when to automatically stop the deployment.

Moving to AWS IoT Greengrass 2.0
Existing devices running AWS IoT Greengrass 1.x will continue to run without any changes. If you want to take advantage of new AWS IoT Greengrass 2.0 features, you will need to move your existing AWS IoT Greengrass 1.x devices and workloads to AWS IoT Greengrass 2.0. To learn how to do this, visit the migration guide.

After you move your 1.x applications over, you can start adding components to your applications using new version 2 features, while leaving your version 1 code as-is until you decide to update them.

AWS IoT Greengrass 2.0 Partners
At launch, industry-leading partners NVIDIA and NXP have qualified a number of their devices for AWS IoT Greengrass 2.0:

See all partner device listings in the AWS Partner Device Catalog. To learn about getting your device qualified, visit the AWS Device Qualification Program.

Available Now
AWS IoT Greengrass 2.0 is available today. Please see the AWS Region table for all the regions where AWS IoT Greengrass is available. For more information, see the developer guide.

Starting today, to help you evaluate, test, and develop with this new release of AWS IoT Greengrass, the first 1,000 devices in your account will not incur any AWS IoT Greengrass charges until December 31, 2021. For pricing information, check out the AWS IoT Greengrass pricing page.

Give it a try, and please send us feedback through your usual AWS Support contacts or the AWS forum for AWS IoT Greengrass.

Learn all the details about AWS IoT Greengrass 2.0 and get started with the new version today.

Channy

Via AWS News Blog https://ift.tt/1EusYcK

New – AWS IoT Core for LoRaWAN to Connect, Manage, and Secure LoRaWAN Devices at Scale

Today, I am happy to announce AWS IoT Core for LoRaWAN, a new fully-managed feature that allows AWS IoT Core customers to connect and manage wireless devices that use low-power long-range wide area network (LoRaWAN) connectivity with the AWS Cloud.

Using AWS IoT Core for LoRaWAN, customers can now set up a private LoRaWAN network by connecting their own LoRaWAN devices and gateways to the AWS Cloud – without developing or operating a LoRaWAN Network Server (LNS) by themselves. The LNS is required to manage LoRaWAN devices and gateways’ connection to the cloud; gateways serve as a bridge and carry device data to and from the LNS, usually over Wi-Fi or Ethernet.

This allows customers to eliminate the undifferentiated work and operational burden of managing an LNS, and enables them to easily and quickly connect and secure LoRaWAN device fleets at scale.

Combined with the long range and deep in-building coverage provided by LoRa technology, AWS IoT Core now enables customers to accelerate IoT application development using AWS services and acting on the data generated easily from connected LoRaWAN devices.

Customers – mostly enterprises – need to develop IoT applications using devices that transmit data over long range (1-3 miles of urban coverage or up to 10 miles for line-of-sight) or through the walls and floors of buildings, for example for real-time asset tracking at airports, remote temperature monitoring in buildings, or predictive maintenance of industrial equipment. Such applications also require devices to be optimized for low-power consumption, so that batteries can last several years without replacement, thus making the implementation cost-effective. Given the extended coverage of LoRaWAN connectivity, it is attractive to enterprises for these use cases, but setting up LoRaWAN connectivity in a privately managed site requires customers to operate an LNS.

With AWS IoT Core for LoRaWAN, you can connect LoRaWAN devices and gateways to the cloud with a few simple steps in the AWS IoT Management Console, thus speeding up the network setup time, and connect off-the-shelf LoRaWAN devices, without any requirement to modify embedded software, for a plug and play experience.

AWS IoT Core for LoRaWAN – Getting Started
Getting started with a LoRaWAN network setup is easy. You can find AWS IoT Core for LoRaWAN qualified gateways and developer kits from the AWS Partner Device Catalog. AWS qualified gateways and developer kits are pre-tested and come with a step by step guide from the manufacturer on how to connect it with AWS IoT Core for LoRaWAN.

With AWS IoT Core console, you can register the gateways by providing a gateway’s unique identifier (provided by the gateway vendor) and selecting LoRa frequency band. For registering devices, you can input device credentials (identifiers and security keys provided by the device vendor) on the console.

Each device has a Device Profile that specifies the device capabilities and boot parameters the LNS requires to set up LoRaWAN radio access service. Using the console, you can select a pre-populated Device Profile or create a new one.

A destination automatically routes messages from LoRaWAN devices to AWS IoT Rules Engine. Once a destination is created, you can use it to map multiple LoRaWAN devices to the same IoT rule. You can write rules using simple SQL queries, to transform and act on the device data, like converting data from proprietary binary to JSON format, raising alerts, or routing it to other AWS services like Amazon Simple Storage Service (S3). From the console, you can also query metrics for connected devices and gateways to troubleshoot connectivity issues.

Available Now
AWS IoT Core for LoRaWAN is available today in US East (N. Virginia) and Europe (Ireland) Regions. With pay-as-you-go pricing and no monthly commitments, you can connect and scale LoRaWAN device fleets reliably, and build applications with AWS services quickly and efficiently. For more information, see the pricing page.

To get started, buy an AWS qualified LoRaWAN developer kit and and launch Getting Started experience in the AWS Management Console. To learn more, visit the developer guide. Give this a try, and please send us feedback either through your usual AWS Support contacts or the AWS forum for AWS IoT.

Learn all the details about AWS IoT Core for LoRaWAN and get started with the new feature today.

Channy

Via AWS News Blog https://ift.tt/1EusYcK

Announcing Amazon Managed Service for Grafana (in Preview)

Today, in partnership with Grafana Labs, we are excited to announce in preview, Amazon Managed Service for Grafana (AMG), a fully managed service that makes it easy to create on-demand, scalable, and secure Grafana workspaces to visualize and analyze your data from multiple sources.

Grafana is one of the most popular open source technologies used to create observability dashboards for your applications. It has a pluggable data source model and support for different kinds of time series databases and cloud monitoring vendors. Grafana centralizes your application data from multiple open-source, cloud, and third-party data sources.

Many of our customers love Grafana, but don’t want the burden of self-hosting and managing it. AMG manages the provisioning, setup, scaling, version upgrades and security patching of Grafana, eliminating the need for customers to do it themselves. AMG automatically scales to support thousands of users with high availability.

With AMG, you will get a fully managed and secure data visualization service where you can query, correlate, and visualize operational metrics, logs and traces across multiple data sources including cloud services such as AWS, Google, and Microsoft. AMG is integrated with AWS data sources, such as Amazon CloudWatch, Amazon Elasticsearch Service, AWS X-Ray, AWS IoT SiteWise, Amazon Timestream, and others to collect operational data in a simple way. Additionally, AMG also provides plug-ins to connect to popular third-party data sources, such as Datadog, Splunk, ServiceNow, and New Relic by upgrading to Grafana Enterprise directly from the AWS Console.

Screenshot for creating and configuring a managed Grafana workspace

AMG integrates directly into your AWS Organizations. You can define a AMG workspace in one AWS account that allows you to discover and access datasources in all your accounts and regions across your AWS organization. Creating dashboards in Grafana is easy as all these different datasources are discoverable in one place.

Customers really like Grafana for the ease of creating dashboards, it comes with many built-in dashboards to use when you add a new data source, or you can take advantage of its broad community of pre-built dashboards. For example, you can see in the following image a really nice dashboard that AMG created for me from one of my AWS Lambda function.

Screenshot of an automatic dashboard for Lambda function

One of my favorite things from AMG is the built-in security features. You can easily enable single sign-on using AWS Single Sign-On, restrict access to data sources and dashboards to the right users, and access audit logs via AWS CloudTrail for your hosted Grafana workspace. With AWS Single Sign-On you can leverage your existing corporate directories to enforce authentication and authorization permissions.

Another powerful feature that AMG has is support for Alerts. AMG integrates with Amazon Simple Notification Service (SNS) so customers can send Grafana alerts to SNS as a notification destination. It also has support for four other alert destinations including PagerDuty, Slack, VictorOps and OpsGenie.

There are no up-front investments required to use AMG, and you only pay a monthly active user license fee. This means that you can provision many users to access to your Grafana workspace, but will only be billed for active users that log in and use the workspace that month. Users granted access but that do not log in, will not be billed that month. You can also upgrade to Grafana Enterprise using AWS Marketplace, to get access to enterprise plugins, support, and training content directly from Grafana Labs.

Availability

This service is available in US East (N. Virginia) and Europe (Ireland) regions. To learn more visit the AMG service page, and be sure to join our re:Invent session tomorrow 12/16 from 8:00am – 8:30am PST for a demo!

AMG is now available in preview; to get access to this service fill out the registration form here.

Marcia

Via AWS News Blog https://ift.tt/1EusYcK

Join the Preview – Amazon Managed Service for Prometheus (AMP)

Observability is an essential aspect of running cloud infrastructure at scale. You need to know that your resources are healthy and performing as expected, and that your system is delivering the desired level of performance to your customers.

A lot of challenges arise when monitoring container-based applications. First, because container resources are transient and there are lots of metrics to watch, the monitoring data has strikingly high cardinality. In plain language this means that there are lots of unique values, which can make it harder to define a space-efficient storage model and to create queries that return meaningful results. Second, because a well-architected container-based system is composed using a large number of moving parts, ingesting, processing, and storing the monitoring data can become an infrastructure challenge of its own.

Prometheus is a leading open-source monitoring solution with an active developer and user community. It has a multi-dimensional data model that is a great fit for time series data collected from containers.

Introducing Amazon Managed Service for Prometheus (AMP)
Today we are launching a preview of Amazon Managed Service for Prometheus (AMP). This fully-managed service is 100% compatible with Prometheus. It supports the same metrics, the same PromQL queries, and can also make use of the 150+ Prometheus exporters. AMP runs across multiple Availability Zones for high availability, and is powered by CNCF Cortex for horizontal scalability. AMP will easily scale to ingest, store, and query millions of time series metrics.

The preview includes support for Amazon Elastic Kubernetes Service (EKS) and Amazon Elastic Container Service (ECS). It can also be used to monitor your self-managed Kubernetes clusters that are running in the cloud or on-premises.

Getting Started with Amazon Managed Service for Prometheus (AMP)
After joining the preview, I open the AMP Console, enter a name for my AMP workspace, and click Create to get started (API and CLI support is also available):

My workspace is active within a minute or so. The console provides me with the endpoints that I can use to write data to my workspace, and to issue queries:

It also provides guidance on how to configure an existing Prometheus server to send metrics to the AMP workspace:

I can also use AWS Distro for OpenTelemetry to scrape Prometheus metrics and send them to my AMP workspace.

Once I have stored some metrics in my workspace, I can run PromQL queries and I can use Grafana to create dashboards and other visualizations. Here’s a sample Grafana dashboard:

Join the Preview
As noted earlier, we’re launching Amazon Managed Service for Prometheus (AMP) in preview form and you are welcome to try it out today.

We’ll have more info (and a more detailed blog post) at launch time.

Jeff;

Via AWS News Blog https://ift.tt/1EusYcK

New – AWS Systems Manager Consolidates Application Management

A desire for consolidated, and simplified operational oversight isn’t limited to just cloud infrastructure. Increasingly, customers ask us for a “single pane of glass” approach for also monitoring and managing their application portfolios.

These customers tell us that detection and investigation of application issues takes additional time and effort, due to the typical use of multiple consoles, tools, and sources of information such as resource usage metrics, logs, and more, to enable their DevOps engineers to obtain context about the application issue under investigation. Here, an “application” means not just the application code but also the logical group of resources that act as a unit to host the application, along with ownership boundaries for operators, and environments such as development, staging, and production.

Today, I’m pleased to announce a new feature of AWS Systems Manager, called Application Manager. Application Manager aggregates operational information from multiple AWS services and Systems Manager capabilities into a single console, making it easier to view operational data for your applications.

To make it even more convenient, the service can automatically discover your applications. Today, auto-discovery is available for applications running in AWS CloudFormation stacks and Amazon Elastic Kubernetes Service (EKS) clusters, or launched using AWS Launch Wizard. Applications can also be discovered from Resource Groups.

A particular benefit of automated discovery is that application components and resources are automatically kept up-to-date on an ongoing basis, but you can also always revise applications as needed by adding or deleting components manually.

With applications discovered and consolidated into a single console, you can more easily diagnose operational issues and resolve them with minimal time and effort. Automated runbooks targeting an application component or resource can be run to help remediate operational issues. For any given application, you can select a resource and explore relevant details without needing to leave the console.

For example, the application can surface Amazon CloudWatch logs, operational metrics, AWS CloudTrail logs, and configuration changes, removing the need to engage with multiple tools or consoles. This means your on-call engineers can understand issues more quickly and reduce the time needed to resolve them.

Exploring an Application with Application Manager
I can access Application Manager from the Systems Manager home page. Once open, I get an overview of my discovered applications and can see immediately that there are some alarms, without needing to switch context to the Amazon CloudWatch console, and some operations items (“OpsItems”) that I might need to pay attention to. I can also switch to the Applications tab to view the collections of applications, or I can click the buttons in the Applications panel for the collection I’m interested in.

Screenshot of the <span title="">Application Manager</span> overview page

In the screenshot below, I’ve navigated to a sample application and again, have indicators showing that alarms have raised. The various tabs enable me to drill into more detail to view resources used by the application, config resource and rules compliance, monitoring alarms, logs, and automation runbooks associated with the application.

Screenshot of application components and overview

Clicking on the Alarm indicator takes me into the Monitoring tab, and it shows that the ConsumedWriteCapacityUnits alarm has been raised. I can change the timescale to zero in on when the event occurred, or I can use the View recent alarms dashboard link to jump into the Amazon CloudWatch Alarms console to view more detail.

Screenshot of alarms on the <span title="">Application Manager</span> Monitoring tab

The Logs tab shows me a consolidated list of log groups for the application, and clicking a log group name takes me directly to the CloudWatch Logs where I can inspect the log streams, and take advantage of Log Insights to dive deeper by querying the log data.

OpsItems shows me operational issues associated with the resources of my application, and enables me to indicate the current status of the issue (open, in progress, resolved). Below, I am marking investigation of a stopped EC2 instance as in progress.

Screenshot of <span title="">Application Manager</span> OpsItems tab

Finally, Runbooks shows me automation documents associated with the application and their execution status. Below, it’s showing that I ran the AWS-RestartEC2Instance automation document to restart the EC2 instance that was stopped, and I would now resolve the issue logged in the OpsItems tab.

Screenshot of <span title="">Application Manager</span>'s Runbooks tab

Consolidating this information into a single console gives engineers a single starting location to monitor and investigate issues arising with their applications, and automatic discovery of applications and resources makes getting started simple. AWS Systems Manager Application Manager is available today, at no extra charge, in all public AWS Regions where Systems Manager is available.

Learn more about Application Manager and get started at AWS Systems Manager.

— Steve Via AWS News Blog https://ift.tt/1EusYcK

New – AWS Systems Manager Fleet Manager

Organizations, and their systems administrators, routinely face challenges in managing increasingly diverse portfolios of IT infrastructure across cloud and on-premises environments. Different tools, consoles, services, operating systems, procedures, and vendors all contribute to complicate relatively common, and related, management tasks. As workloads are modernized to adopt Linux and open-source software, those same systems administrators, who may be more familiar with GUI-based management tools from a Windows background, have to continually adapt and quickly learn new tools, approaches, and skill sets.

AWS Systems Manager is an operational hub enabling you to manage resources on AWS and on-premises. Available today, Fleet Manager is a new console based experience in Systems Manager that enables systems administrators to view and administer their fleets of managed instances from a single location, in an operating-system-agnostic manner, without needing to resort to remote connections with SSH or RDP. As described in the documentation, managed instances includes those running Windows, Linux, and macOS operating systems, in both the AWS Cloud and on-premises. Fleet Manager gives you an aggregated view of your compute instances regardless of where they exist.

All that’s needed, whether for cloud or on-premises servers, is the Systems Manager agent installed on each server to be managed, some AWS Identity and Access Management (IAM) permissions, and AWS Key Management Service (KMS) enabled for Systems Manager‘s Session Manager. This makes it an easy and cost-effective approach for remote management of servers running in multiple environments without needing to pay the licensing cost of expensive management tools you may be using today. As noted earlier, it also works with instances running macOS. With the agent software and permissions set up, Fleet Manager enables you to explore and manage your servers from a single console environment. For example, you can navigate file systems, work with the registry on Windows servers, manage users, and troubleshoot logs (including viewing Windows event logs) and monitor common performance counters without needing the Amazon CloudWatch agent to be installed.

Exploring an Instance With Fleet Manager
To get started exploring my instances using Fleet Manager, I first head to the Systems Manager console. There, I select the new Fleet Manager entry on the navigation toolbar. I can also select the Managed Instances option – Fleet Manager replaces Managed Instances going forward, but the original navigation toolbar entry will be kept for backwards compatibility for a short while. But, before we go on to explore my instances, I need to take you on a brief detour.

When you select Fleet Manager, as with some other views in Systems Manager, a check is performed to verify that a role, named AmazonSSMRoleForInstancesQuickSetup, exists in your account. If you’ve used other components of Systems Manager in the past, it’s quite possible that it does. The role is used to permit Systems Manager to access your instances on your behalf and if the role exists, then you’re directed to the requested view. If however the role doesn’t exist, you’ll first be taken to the Quick Setup view. This in itself will trigger creation of the role, but you might want to explore the capabilities of Quick Setup, which you can also access any time from the navigation toolbar.

Quick Setup is a feature of Systems Manager that you can use to set up specific configuration items, such as the Systems Manager and CloudWatch agents on your instances (and keep them up-to-date), and also IAM roles permitting access to your resources for Systems Manager components. For this post, all the instances I’m going to use already have the required agent set up, including the role permissions, so I’m not going to discuss this view further but I encourage you to check it out. I also want to remind you that to take full advantage of Fleet Manager‘s capabilities you first need to have KMS encryption enabled for your instances and secondly, the role attached to your Amazon Elastic Compute Cloud (EC2) instances must have the kms:Decrypt role permission included, referencing the key you selected when you enabled KMS encryption. You can enable encryption, and select the KMS key, using the Preferences section of the Session Manager console, and of course you can set up the role permission in the IAM console.

That’s it for the diversion; if you have the role already, as I do, you’ll now be at the Managed instances list view. If you’re at Quick Setup instead, simply click the Fleet Manager navigation button once more.

The Managed instances view shows me all of my instances, in the cloud or on-premises, that I can access. Selecting an instance, in this case an EC2 Windows instance launched using AWS Elastic Beanstalk, and clicking Instance actions presents me with a menu of options. The options (less those specific to Windows) are available for my Amazon Linux instance too, and for instances running macOS I can use the View file system option.

Screenshot of <span title="">Fleet Manager</span>'s Managed instances view

The File system view displays a read-only view onto the file system of the selected instance. This can be particularly useful for viewing text-based log files, for example, where I can preview up to 10,000 lines of a log file and even tail it to view changes as the log updates. I used this to open and tail an IIS web server log on my Windows Server instance. Having selected the instance, I next select View file system from the Instance actions dropdown (or I can click the Instance ID to open a view onto that instance and select File system from the menu displayed on the instance view).

Having opened the file system view for my instance, I navigate to the folder on the instance containing the IIS web server logs.

Screenshot of <span title="">Fleet Manager</span>'s File system view

Selecting a log file, I then click Actions and select Tail file. This opens a view onto the log file contents, which updates automatically as new content is written.

Screenshot of tailing a log file in <span title="">Fleet Manager</span>

As I mentioned, the File system view is also accessible for macOS-based instances. For example, here is a screenshot of viewing the Applications folder on an EC2 macOS instance.

Screenshot of macOS file system view in <span title="">Fleet Manager</span>

Next, let’s examine the Performance counters view, which is available for both Windows and Linux instances. This view displays CPU, memory, network traffic, and disk I/O and will be familiar to Windows users from Task Manager. The metrics shown reflect the guest OS metrics, whereas EC2 instance metrics you may be used to relate to the hypervisor. On this particular instance I’ve deployed an ASP.NET Core 5 application, which generates a varying length collection of Fibonacci numbers on page refresh. Below is a snapshot of the counters, after I’ve put the instance under a small amount of load. The view updates automatically every 5 seconds.

Screenshot of <span title="">Fleet Manager</span>'s Performance Counters view

There are more views available than I have space for in this post. Using the Windows Registry view, I can view and edit the registry on the selected Windows instance. Windows event logs gives me access to the Application and Service logs, and common Windows logs such as System, Setup, Security, etc. With Users and groups I can manage users or groups, including assignment of users to groups (again for both Windows and Linux instances). For all views, Fleet Manager enables me to use a single and convenient console.

Getting Started
AWS Systems Manager Fleet Manager is available today for use with managed instances running Windows, Linux, and macOS. Information on pricing, for this and other Systems Manager features, can be found at this page.

Learn more, and get started with Fleet Manager today, at AWS Systems Manager.

— Steve Via AWS News Blog https://ift.tt/1EusYcK

Introducing AWS Systems Manager Change Manager

Because you are constantly listening to the feedback from your customer, you are iterating, innovating, and improving your applications and infrastructures. You continually modify your IT systems in the cloud. And let’s face it, changing something in a working system risks breaking things or introducing side effects that are sometimes unpredictable; it doesn’t matter how many tests you do. On the other hand, not making changes is stasis, followed by irrelevance, followed by death.

This is why organizations of all sizes and types have embraced a culture of controlling changes. Some organizations adopt change management processes such as the ones defined in ITIL v4. Some have adopted DevOps’ Continuous Deployment, or other methods. In any case, to support your change management processes, it is important to have tools.

Today, we are launching AWS Systems Manager Change Manager, a new change management capability for AWS Systems Manager. It simplifies the way ops engineers track, approve, and implement operational changes to their application configurations and infrastructures.

Using Change Manager has two primary advantages. First, it can improve the safety of changes made to application configurations and infrastructures, reducing the risk of service disruptions. It makes operational changes safer by tracking that only approved changes are being implemented. Secondly, it is tightly integrated with other AWS services, such as AWS Organizations and AWS Single Sign-On, or the integration with the Systems Manager change calendar and Amazon CloudWatch alarms.

Change Manager provides accountability with a consistent way to report and audit changes made across your organization, their intent, and who approved and implemented them.

Change Manager works across AWS Regions and multiple AWS accounts. It works closely with Organizations and AWS SSO to manage changes from a central point and to deploy them in a controlled way across your global infrastructure.

Terminology
You can use AWS Systems Manager Change Manager on a single AWS account, but most of the time, you will use it in a multi-account configuration.

The way you manage changes across multiple AWS accounts depends on how these accounts are linked together. Change Manager uses the relationships between your accounts defined in AWS Organizations. When using Change Manager, there are three types of accounts:

  • The management account – also known as the “main account” or “root account.” The management account is the root account in an AWS Organizations hierarchy. It is the management account by virtue of this fact.
  • The delegated administrator account – A delegated administrator account is an account that has been granted permission to manage other accounts in Organizations. In the Change Manager context, this is the account from which change requests will be initiated. You will typically log in to this account to manage templates and change requests. Using a delegated administrators account allows you to limit connections made to the root account. It also allows you to enforce a least privileges policy by using a specific subset of permissions required by the changes.
  • The member accounts – Member accounts are accounts that are not the management account or a delegated administrator account, but are still included in Organizations. In my mental model for Change Manager, these would be the accounts that hold the resources where changes are deployed. A delegated administrator account would initiate a change request that would impact resources in a member account. System administrators are discouraged from logging directly into these accounts.

Let’s see how you can use AWS Systems Manager Change Manager by taking a short walk-through demo.

One-Time Configuration
In this scenario, I show you how to use Change Manager with multiple AWS accounts linked together with Organizations. If you are not interested in the one-time configuration, jump to the Create a Change Request section below.

There are four one-time configuration actions to take before using Change Manager: one action in the root account and three in the delegated administrator account. In the root account, I use Quick Setup to define my delegated administrator account and initially configure permissions on the accounts. In the delegated administrator account, you define your source of user identities, you define what users have permissions to approve change templates, and you define a change request template.

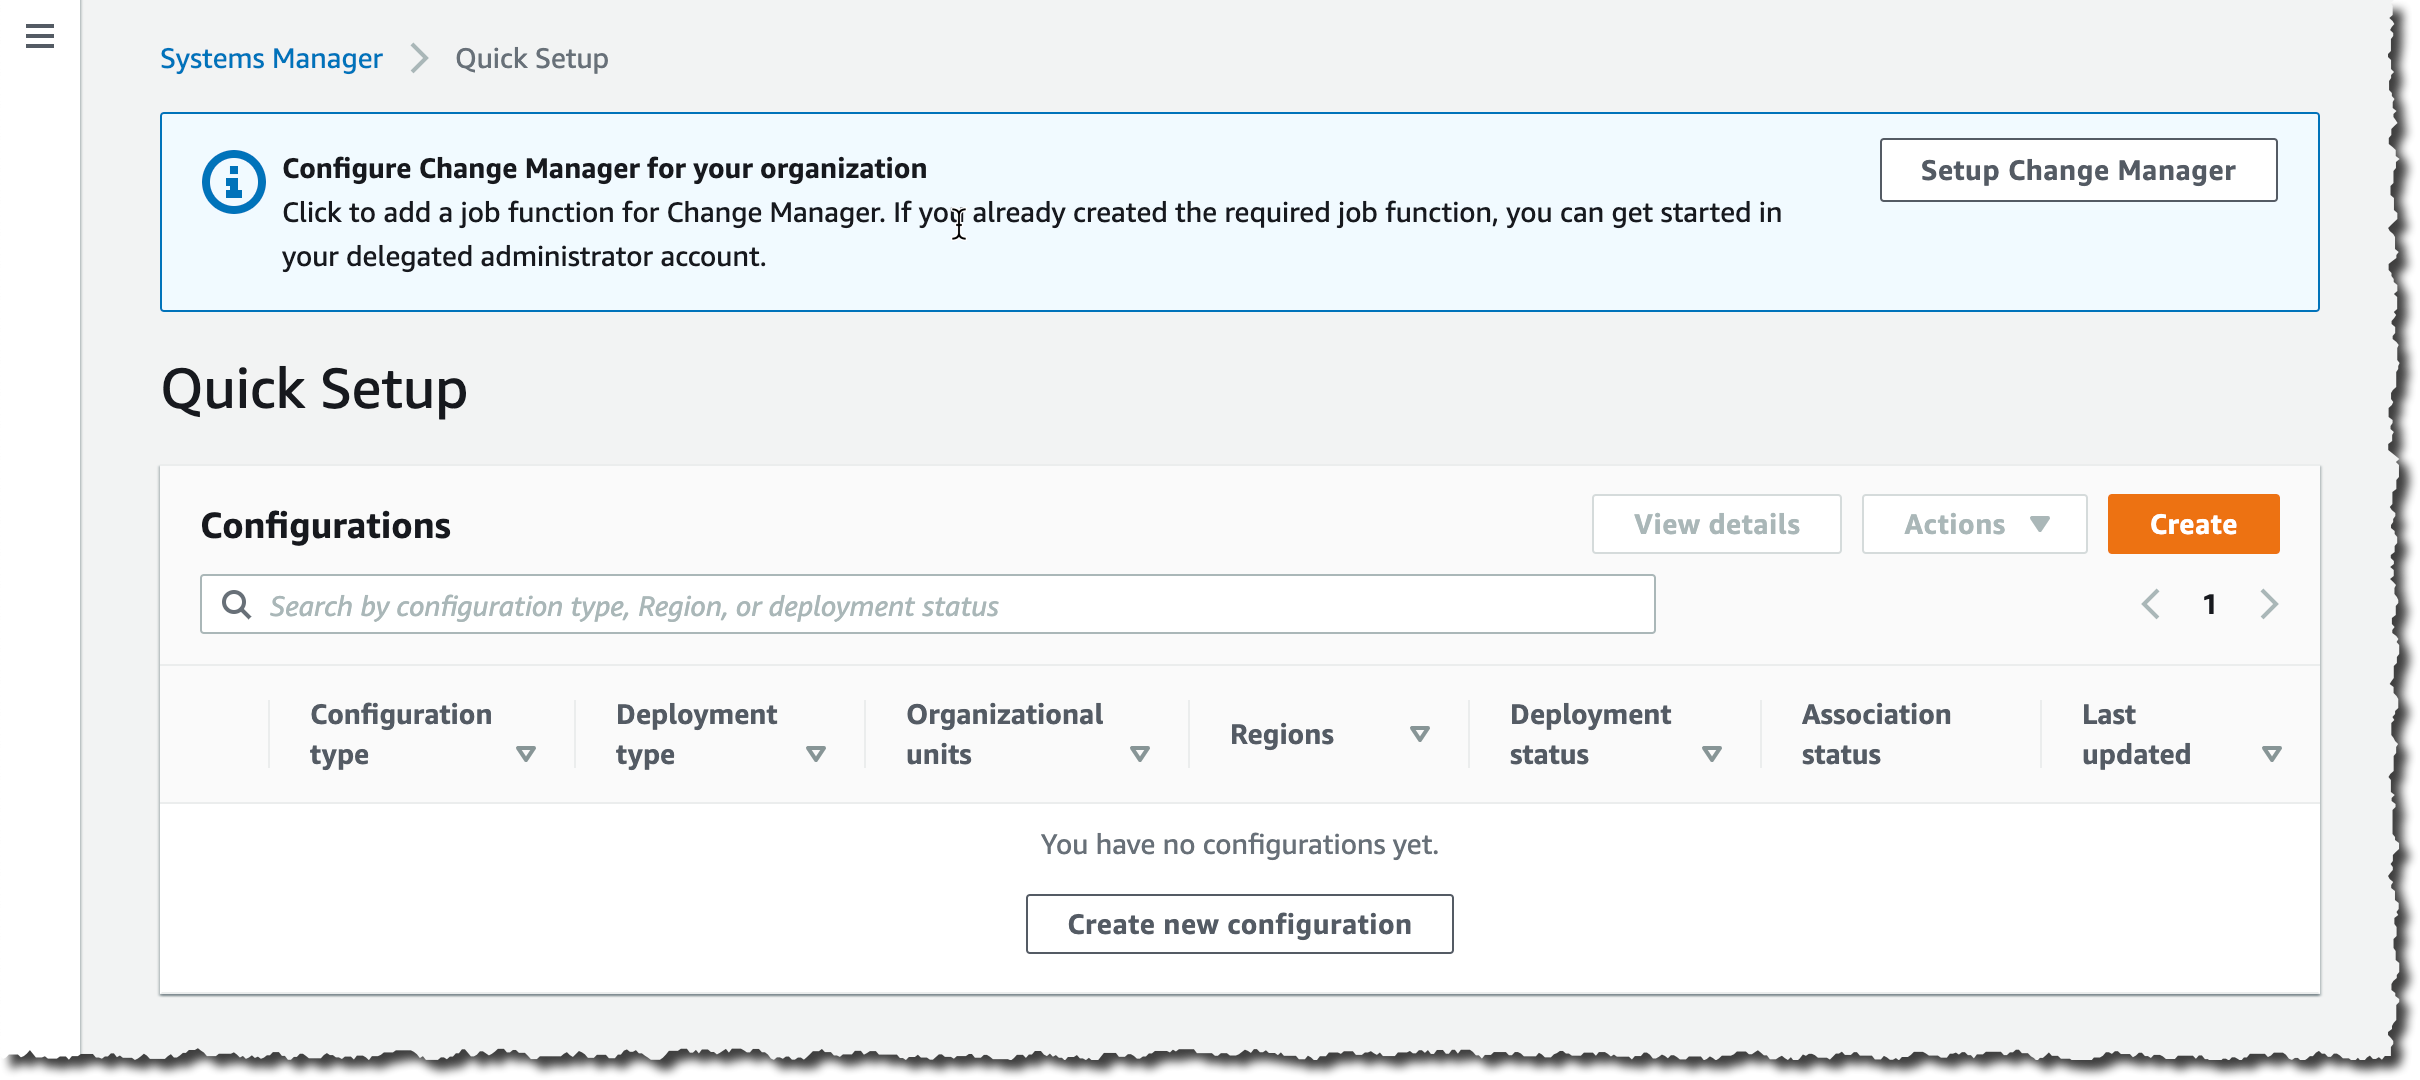
First, I ensure I have an Organization in place and my AWS accounts are organized in Organizational Units (OU). For the purpose of this simple example, I have three accounts: the root account, the delegated administrator account in the management OU and a member account in the managed OU. When ready, I use Quick Setup on the root account to configure my accounts. There are multiple paths leading to Quick Setup; for this demo, I use the blue banner on top of the Quick Setup console, and I click Setup Change Manager.

Change Manager Quick Setup


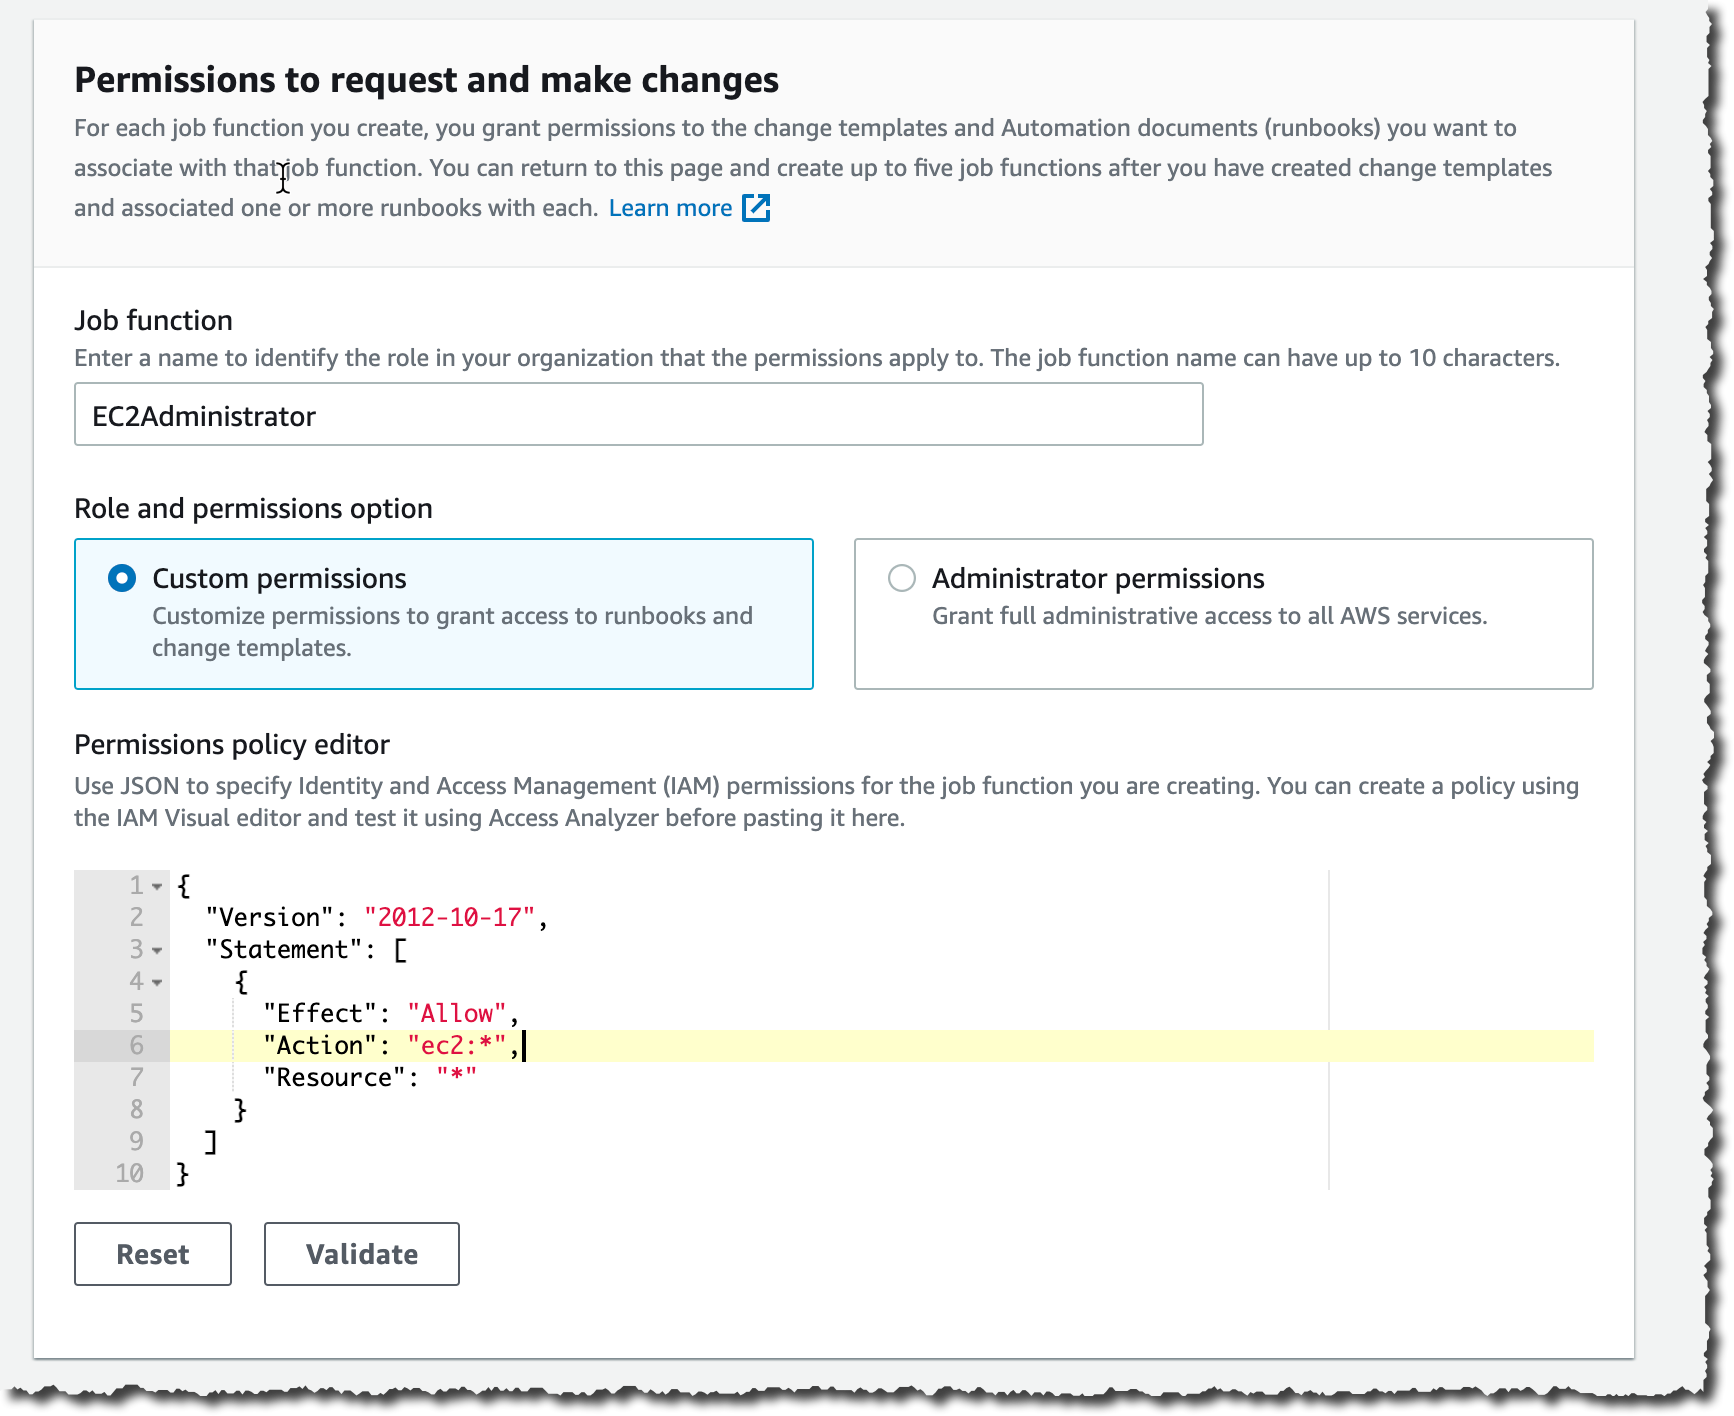
On the Quick Setup page, I enter the ID of the delegated administrator account if I haven’t defined it already. Then I choose the permissions boundaries I grant to the delegated administrator account to perform changes on my behalf. This is the maximum permissions Change Manager receives to make changes. I will further restrict this permission set when I create change requests in a few minutes. In this example, I grant Change Manager permissions to call any ec2 API. This effectively authorizes Change Manager to only run changes related to EC2 instances.

Change Manager Quick Setup

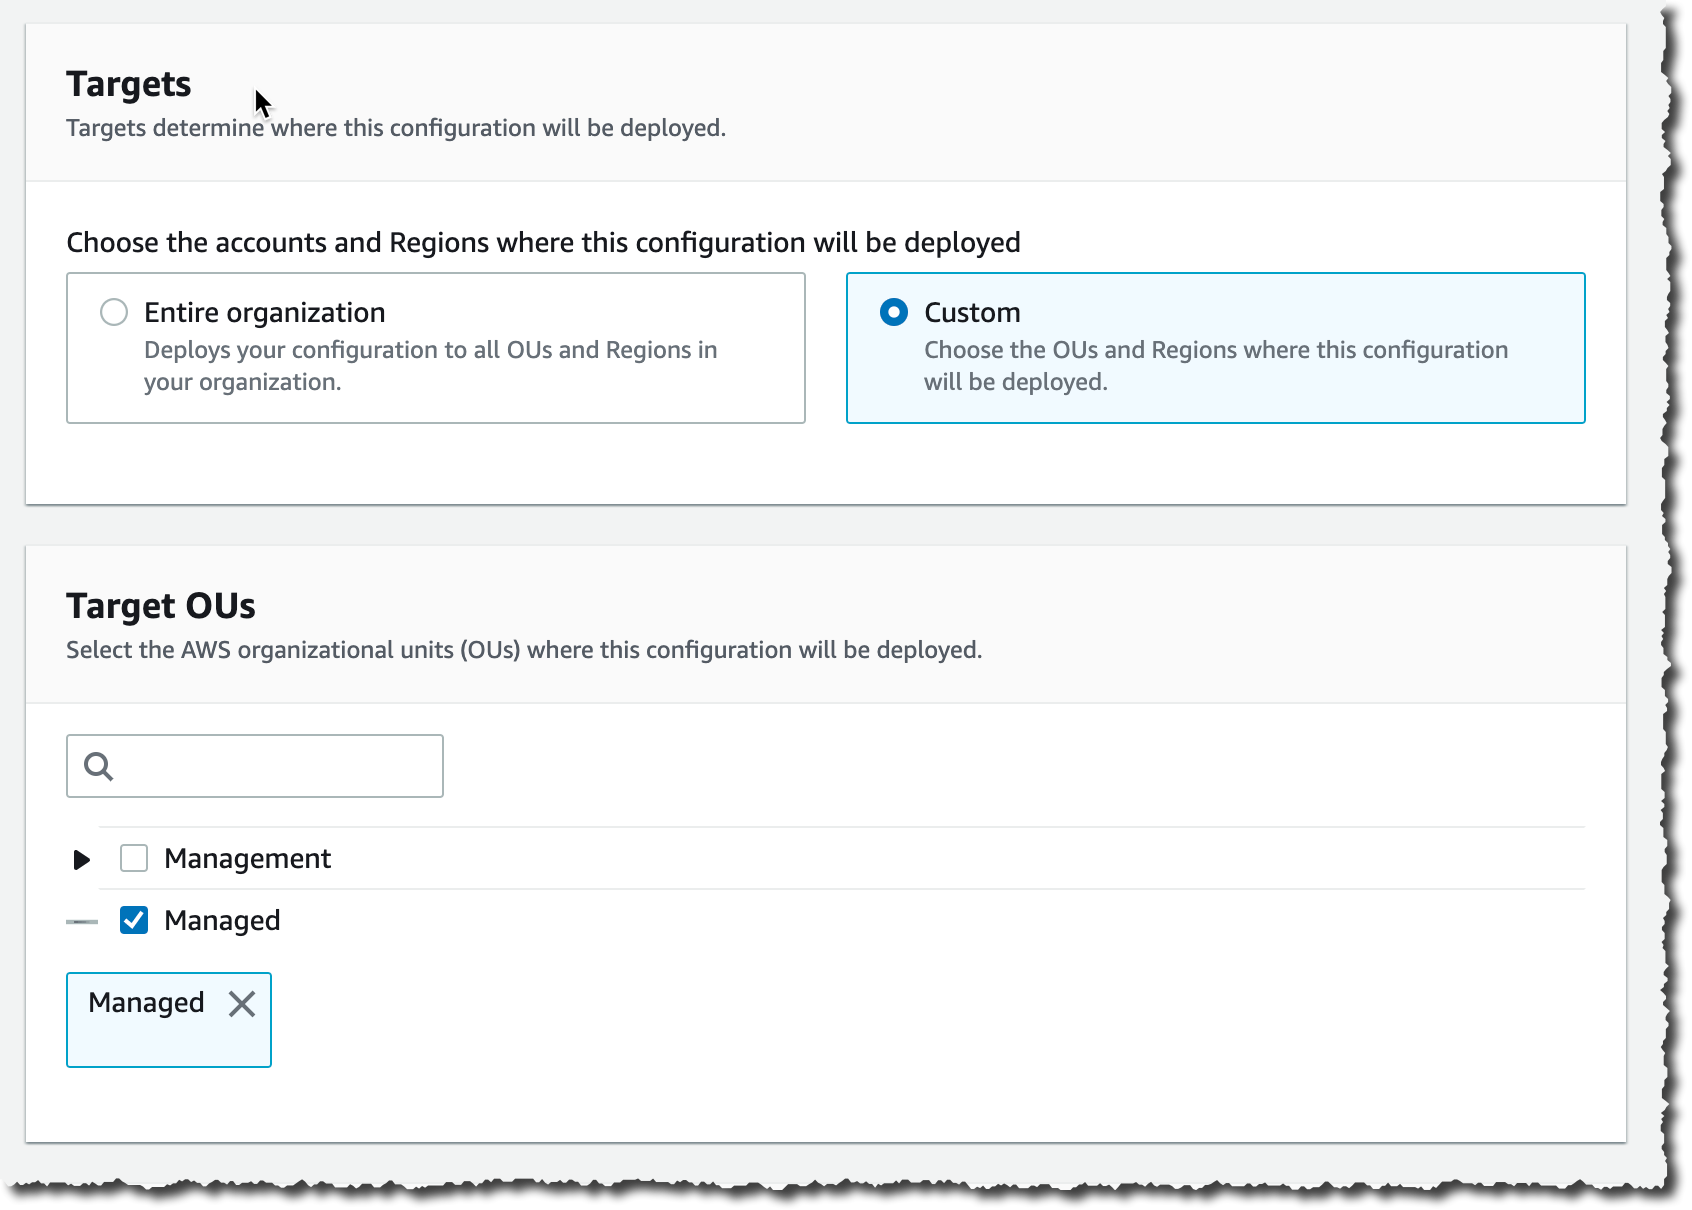
Lower on the screen, I choose the set of accounts that are targets for my changes. I choose between Entire organization or Custom to select one or multiple OUs.

Change Manager Quick Setup 2

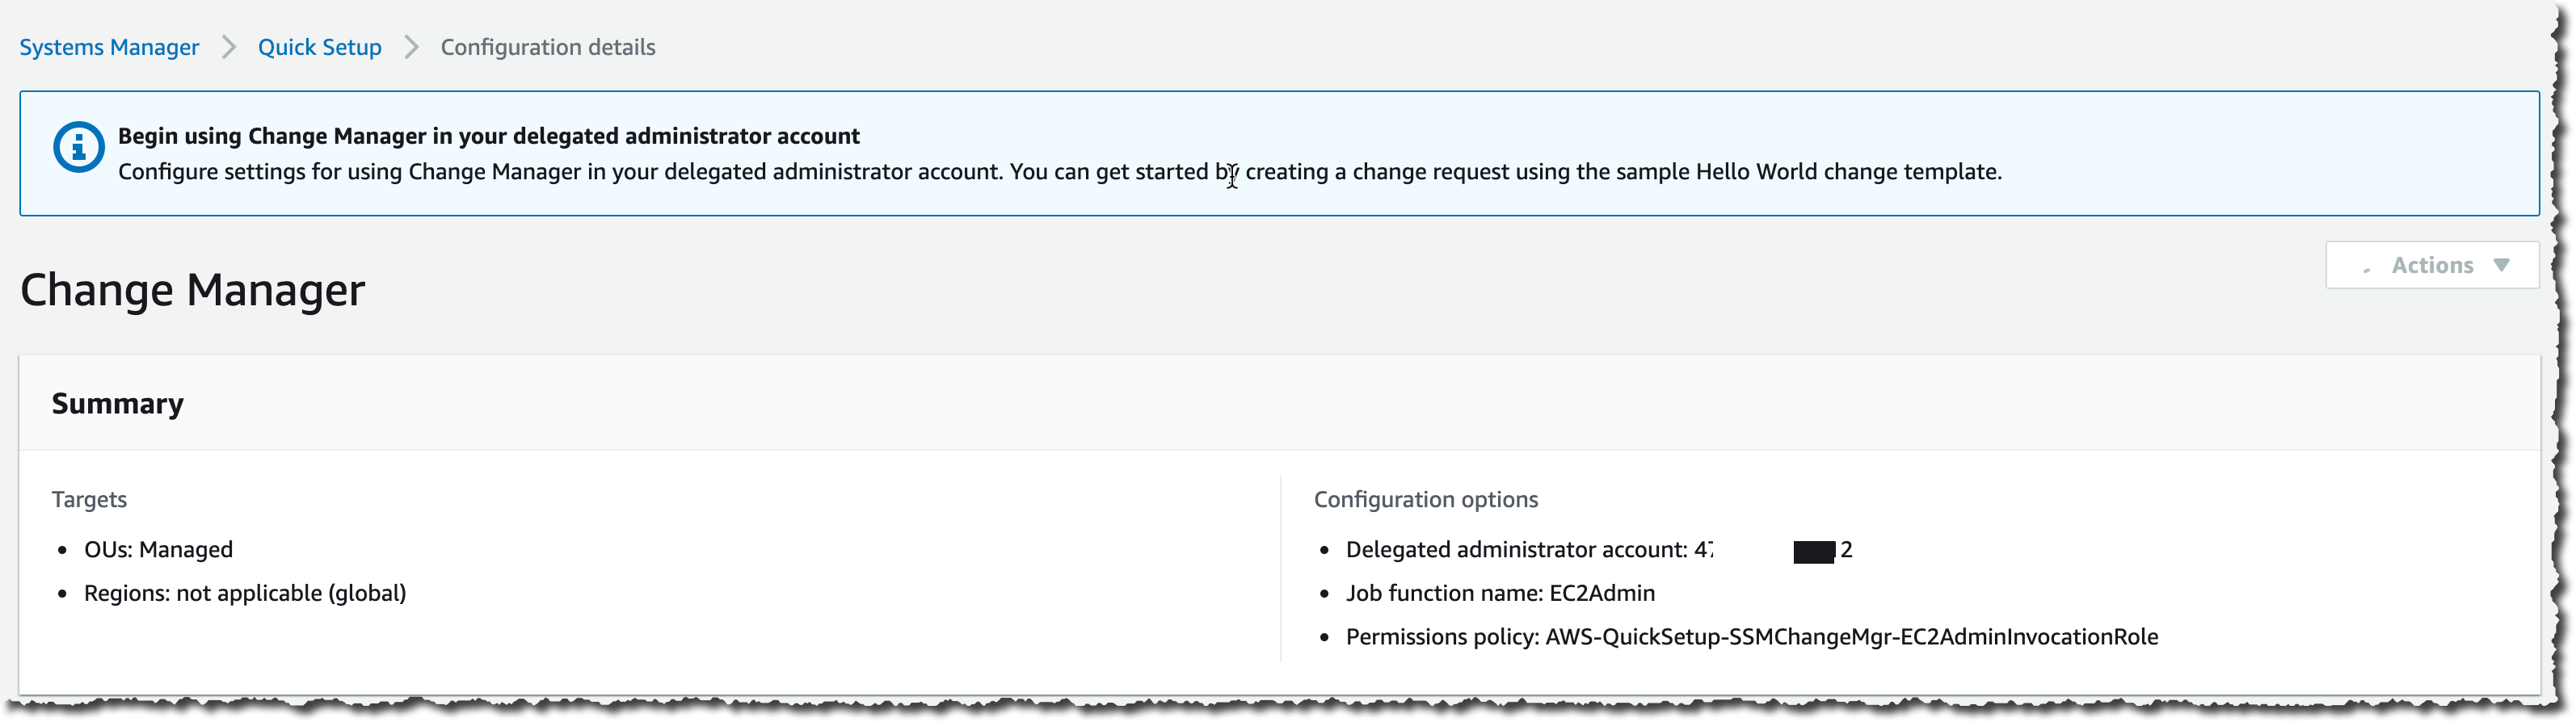
After a while, Quick Setup finishes configuring my AWS accounts permission and I can move to the second part of the one-time setup.

Change Manager Quick Setup 3

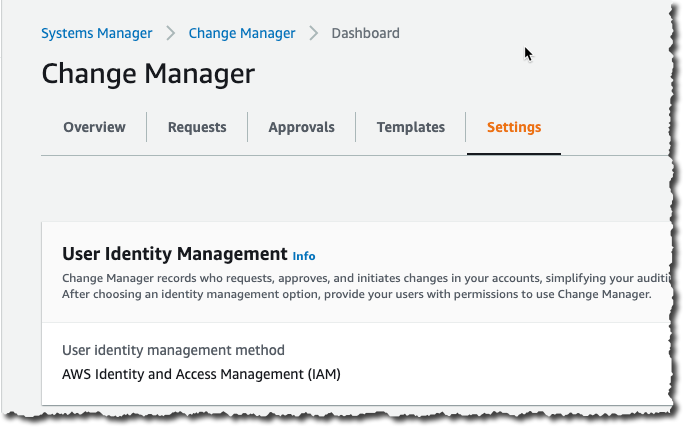
Second, I switch to my delegated administrator account. Change Manager asks me how I manage users in my organization: with AWS Identity and Access Management (IAM) or AWS Single Sign-On? This defines where Change Manager pulls user identities when I choose approvers. This is a one-time configuration option. This can be changed at any time in the Change Manager Settings page.

Change Manager Settings

Third, on the same page, I define an Amazon Simple Notification Service (SNS) topic to receive notifications about template reviews. This channel is notified any time a template is created or modified, to let template approvers review and approve templates. I also define the IAM (or SSO) user with permission to approve change templates (more about these in one minute).

Change Manager Template Reviewers

Optionally, you can use the existing AWS Systems Manager Change Calendar to define the periods where changes are not authorized, such as marketing events or holiday sales.

Finally, I define a change template. Every change request is created from a template. Templates define common parameters for all change requests based on them, such as the change request approvers, the actions to perform, or the SNS topic to send notifications of progress. You can enforce the review and approval of templates before they can be used. It makes sense to create multiple templates to handle different type of changes. For example, you can create one template for standard changes, and one for emergency changes that overrides the change calendar. Or you can create different templates for different types of automation run books (documents).

To help you to get started, we created a template for you: the “Hello World” template. You can use it as a starting point to create a change request and test out your approval flow.

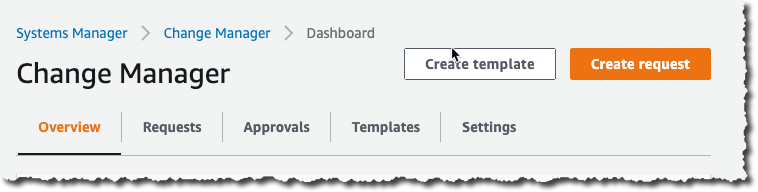
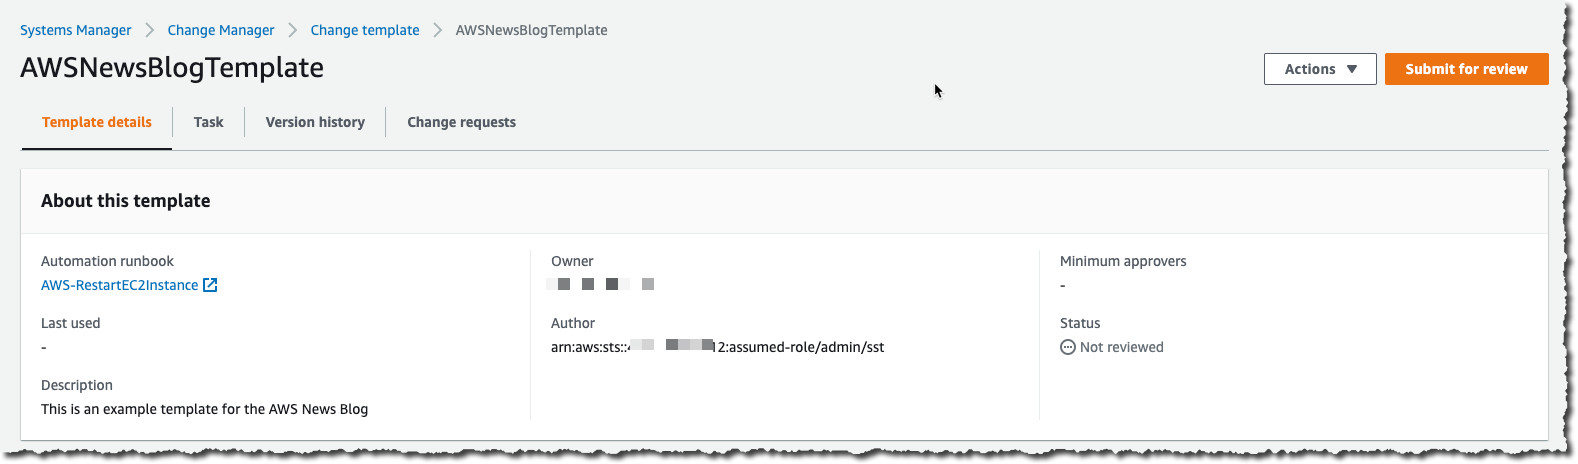
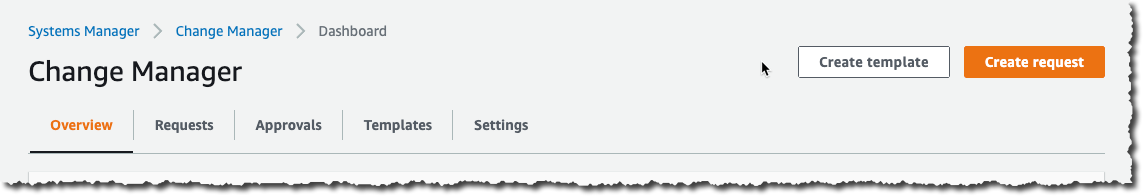
At any time, I can create my own template. Let’s imagine my system administrator team is frequently restarting EC2 instances. I create a template allowing them to create change requests to restart one or multiple instances. Using the delegated administrator account, I navigate to the Change Manager management console and click Create template.

Change Manager Create Template

In a nutshell, a template defines the list of authorized actions, where to send notifications and who can approve the change request. Actions are an AWS Systems Manager runbook. Emergency change templates allow change requests to bypass the change calendar I wrote about earlier. Under Runbook Options, I choose one or multiple runbooks allowed to run. For this example, I choose the AWS EC2RestartInstance runbook.

I use the console to create the template, but templates are defined internally as YAML. I can edit the YAML using the Editor tab, or when I am using the AWS Command Line Interface (CLI) or API. This means I can version control them just like the rest of my infrastructure (as code).Change Manager Create Template part 1

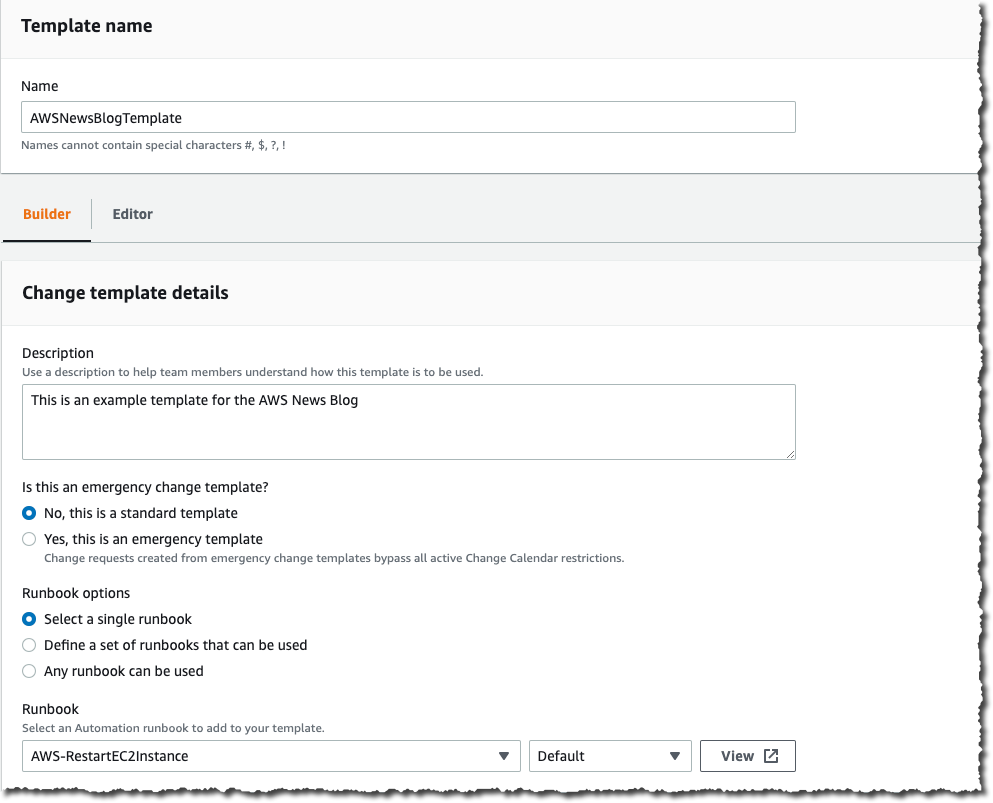
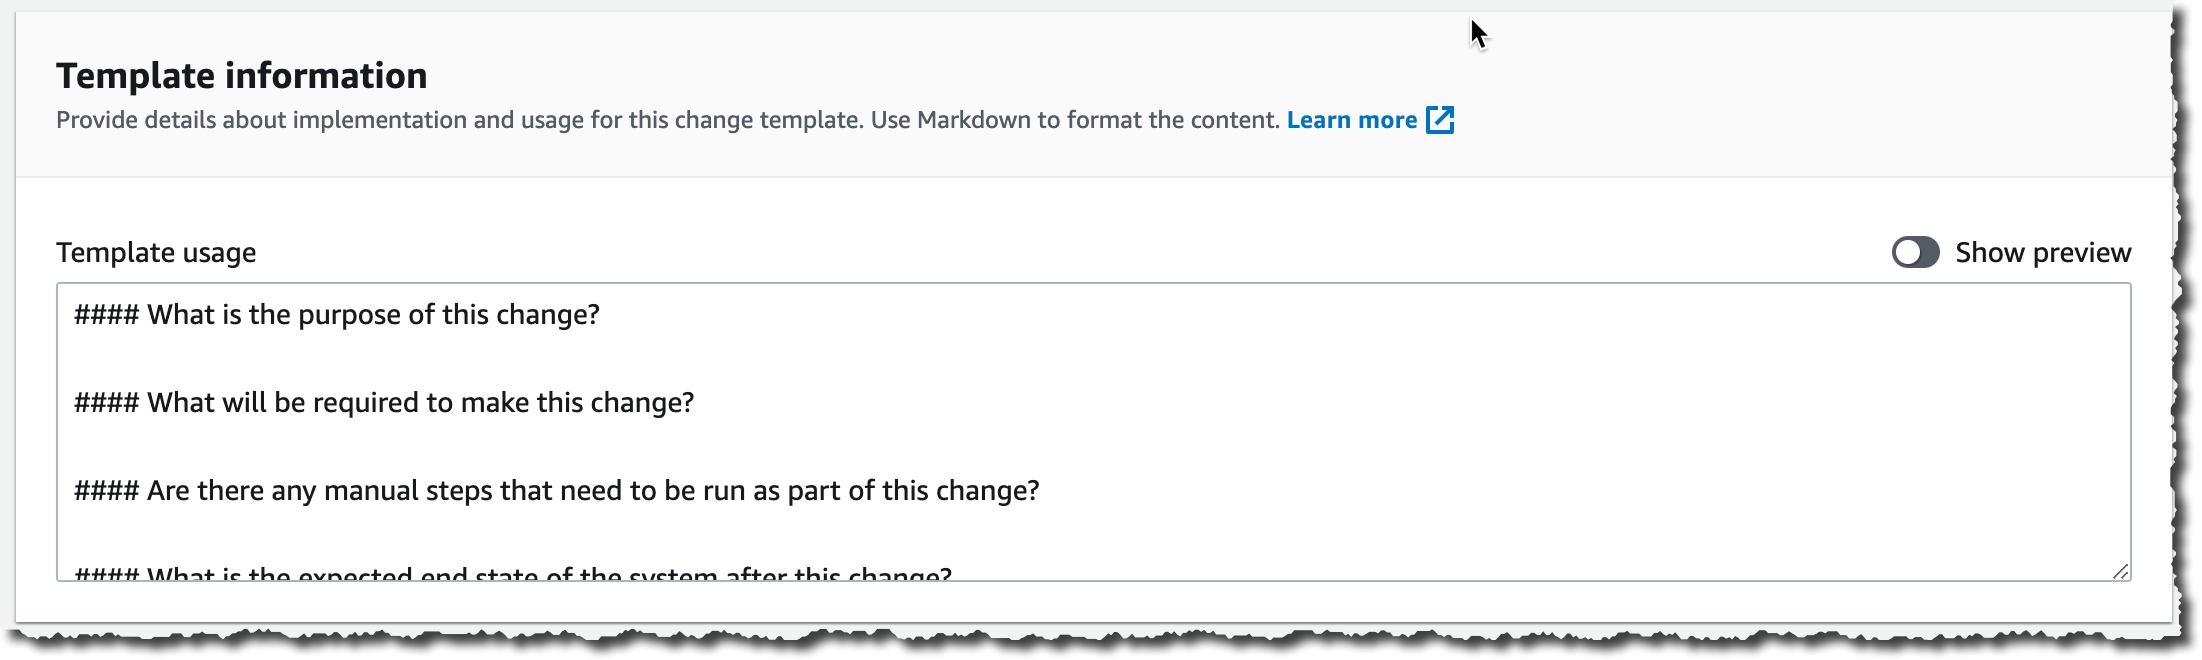
Just below, I document my template using text formatted as markdown format. I use this section to document the defining characteristics of the template and provide any necessary instructions, such as back-out procedures, to the requestor.

Change Manager Template Documentation

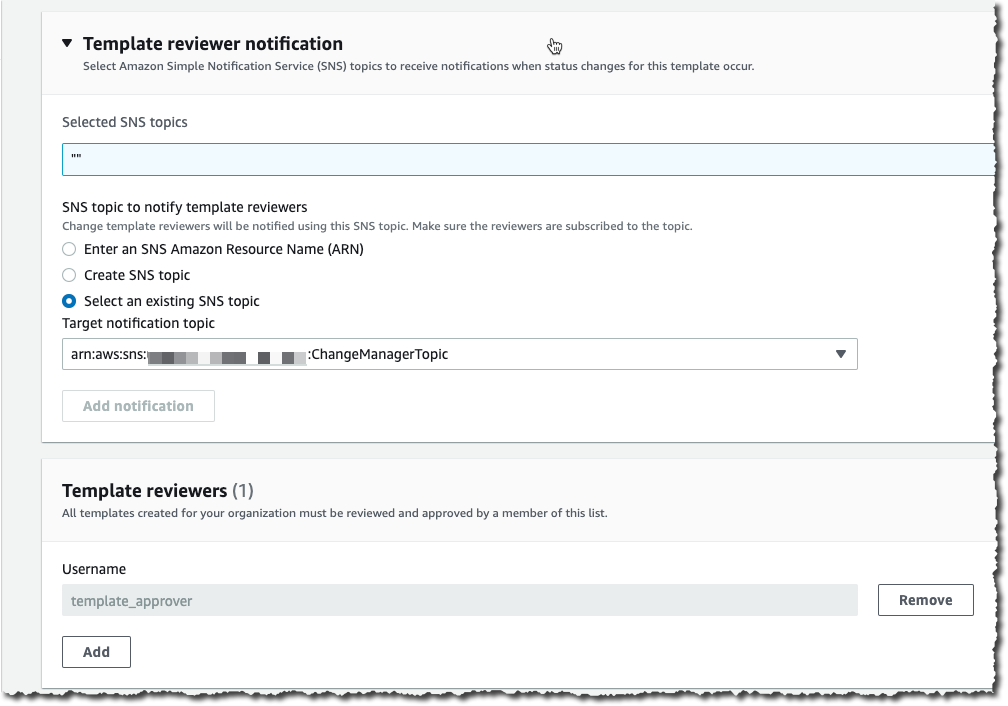
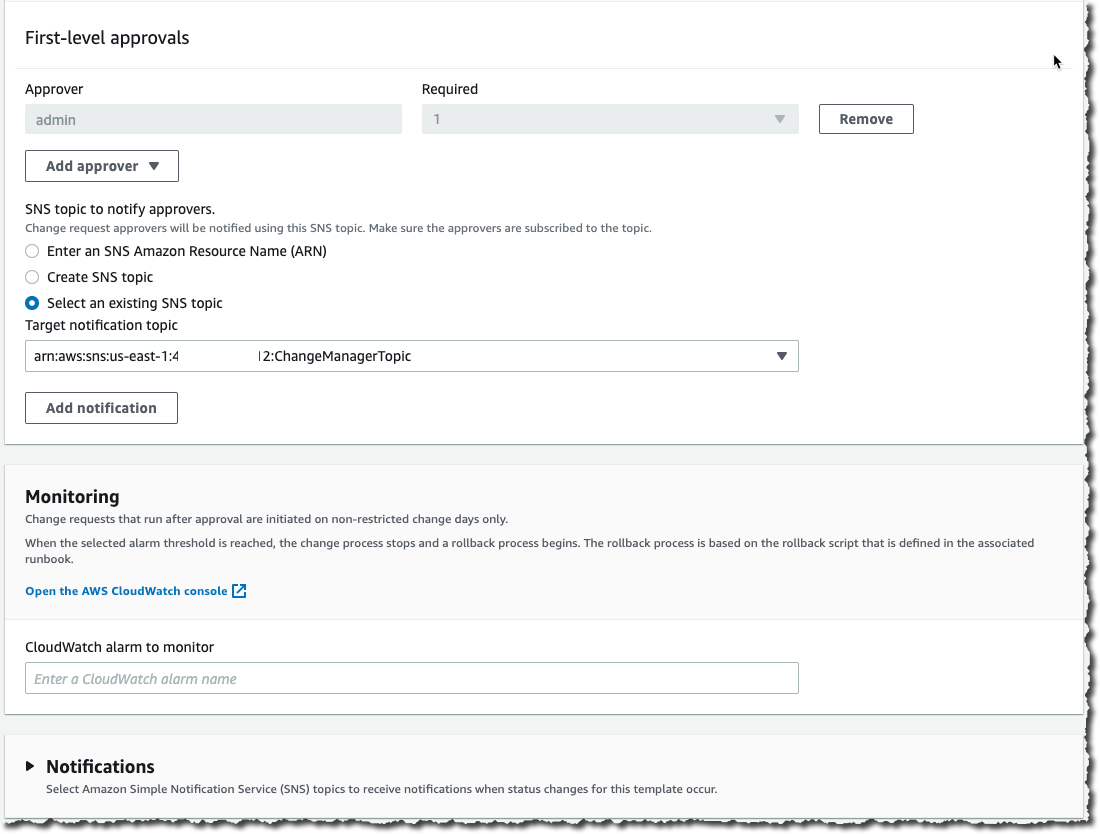
I scroll down that page and click Add Approver to define approvers. Approvers can be individual users or groups. The list of approvers are defined either at the template level or in the change request itself. I also choose to create an SNS topic to inform approvers when any requests are created that require their approval.

In the Monitoring section I select the alarm that, when active, stops any change based on this template, and initiate a rollback.

In the Notifications section, I select or create another SNS topic so I’m notified when status changes for this template occur.

Change Manager Create Template part 2

Once I am done, I save the template and submit it for review.

Change Manager Submit Template for Review

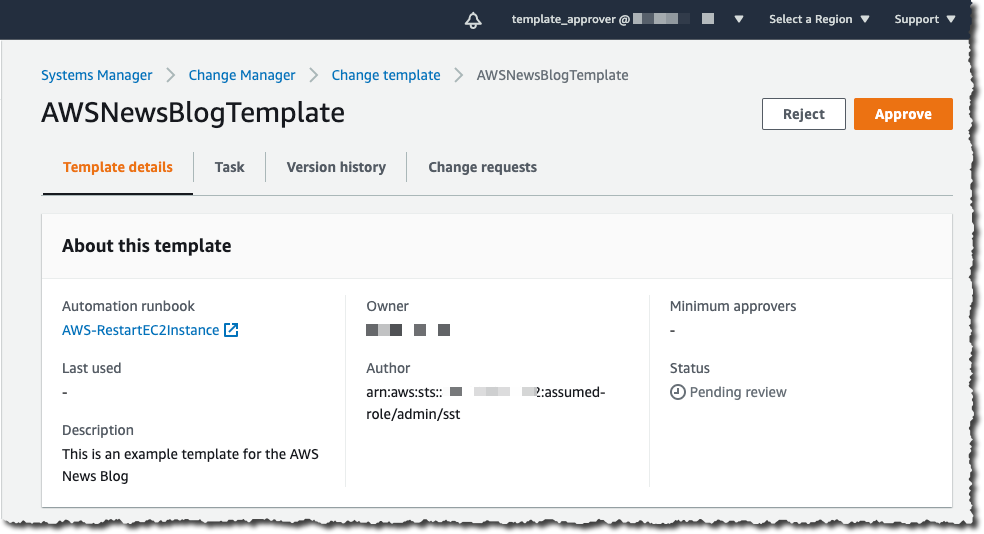
Templates have to be reviewed and approved before they can be used. To approve the template, I connect the console as the template_approver user I defined earlier. As template_approver user, I see pending approvals on the Overview tab. Or, I navigate to the Templates tab, select the template I want to review. When I am done reviewing it, I click Approve.

Change Manager Approve Template

Voila, now we’re ready to create change requests based on this template. Remember that all the preceding steps are one-time configurations and can be amended at any time. When existing templates are modified, the changes go through a review and approval process again.

Create a Change Request
To create a change request on any account linked to the Organization, I open a AWS Systems Manager Change Manager console from the delegated administrator account and click Create request.

Change Manager Create Request

I choose the template I want to use and click Next.

Change Manager Select Template 
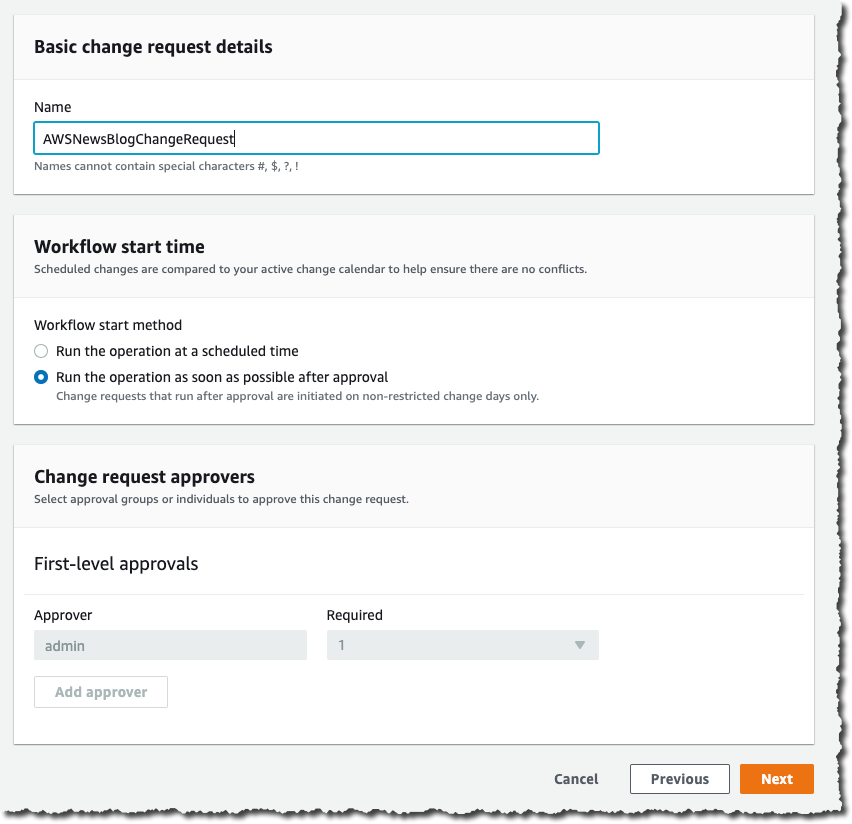
I enter a name for this change request. The change is initiated immediately after all approvals are granted, or I specify an optional scheduled time. When the template allows me, I choose the approver for this change. In this example, the approver is defined by the template and cannot be changed. I click Next.

Change Manager Create CR part 1

On the next screen, there are multiple important configuration options, relating to the actual execution of the change:

  • Target location – lets me define on which target AWS accounts and AWS Region I want to run this change.
  • Deployment target – lets me define which resources are the target of this change. One EC2 instance? Or multiple ones identified by their tags, their resources groups, a list of instance IDs, or all EC2 instances.
  • Runbook parameters – lets me define the parameters I want to pass to my runbook, if any.
  • Execution role – lets me define the set of permissions I grant the System Manager to deploy with this change. The permission set must have service changemanagement.ssm.amazonaws.com as principal for the trust policy. Selecting a role allows me to grant the Change Manager runtime a different permission set than the one I have.

Here is an example allowing Change Manager to stop an EC2 instance (you can scope it down to a specific AWS account, specific Region, or specific instances):

{
    "Version": "2012-10-17",
    "Statement": [
        {
            "Effect": "Allow",
            "Action": [
                "ec2:StartInstances",
                "ec2:StopInstances"
            ],
            "Resource": "*",
        },
        {
            "Effect": "Allow",
            "Action": "ec2:DescribeInstances",
            "Resource": "*"
        }
    ]
}

And the associated trust policy:

{
  "Version": "2012-10-17",
  "Statement": [
    {
      "Effect": "Allow",
      "Principal": {
        "Service": "changemanagement.ssm.aws.internal"
      },
      "Action": "sts:AssumeRole"
    }
  ]
}

When I am ready, I click Next. On the last page, I review my data entry and click Submit for approval.

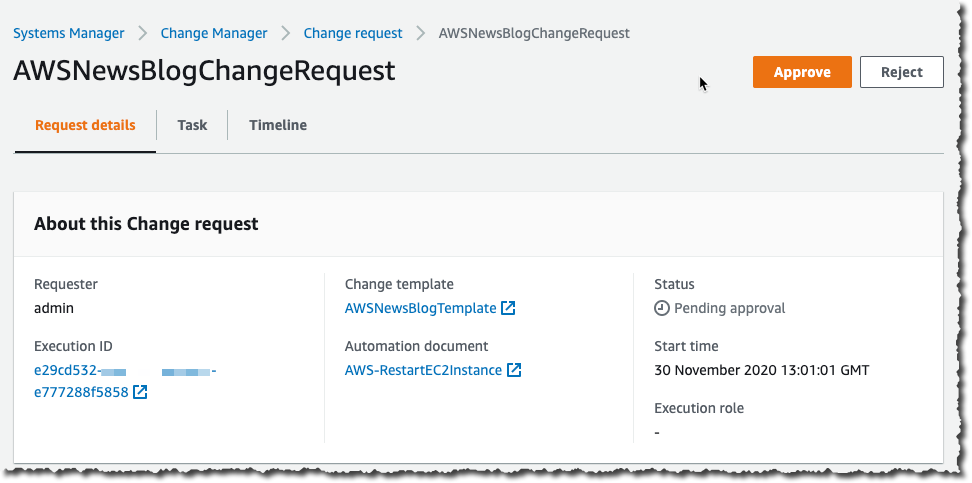
At this stage, the approver receives a notification, based on the SNS topic configured in the template. To continue this demo, I sign out of the console and sign in again as the cr_approver user, which I created, with permission to view and approve change requests.

As the cr_approver user, I navigate to the console, review the change request, and click Approve.

Change Manager Review Change Request

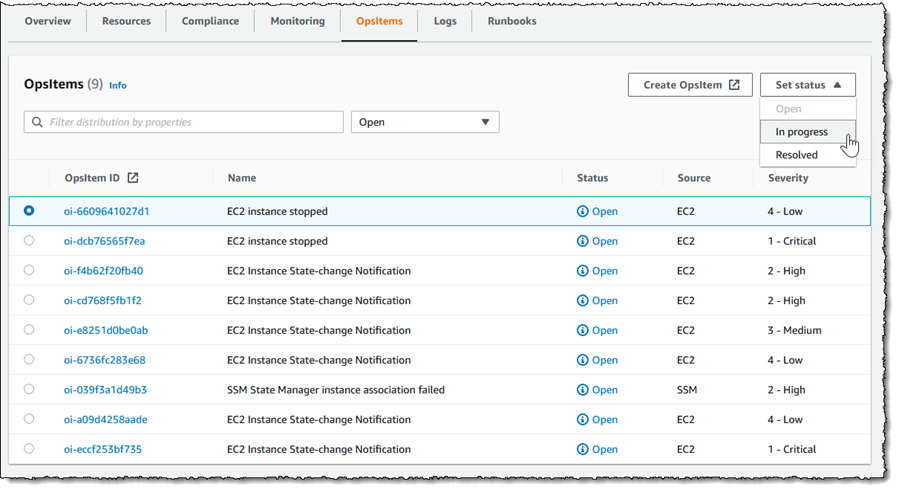
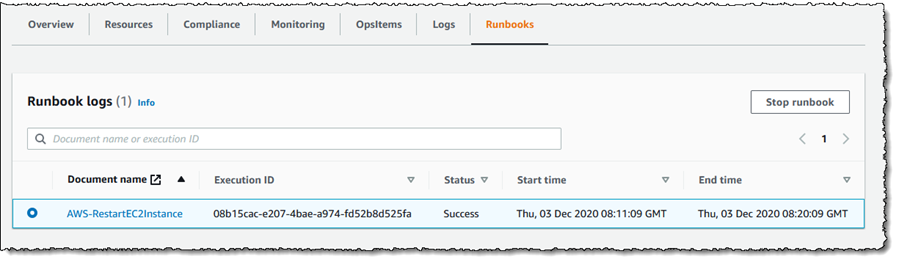
The change request status switches to scheduled, and eventually turns green to Success. At any time, I can click the change request to get the status, and to collect errors, if any.

Change Manager Dashboard with Succeeded Request

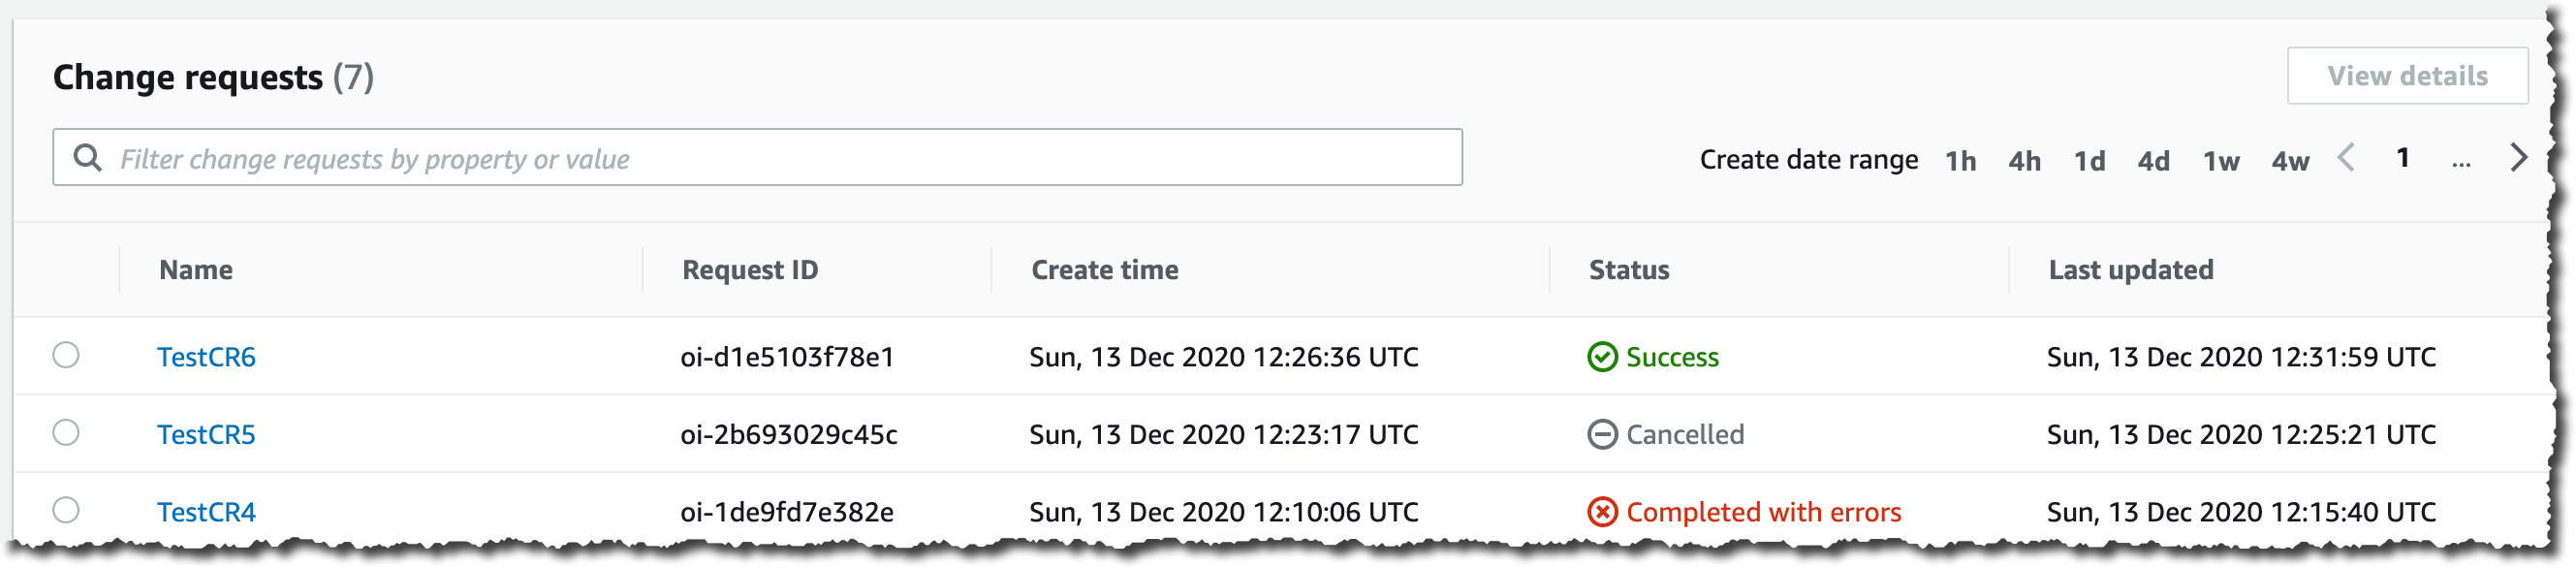
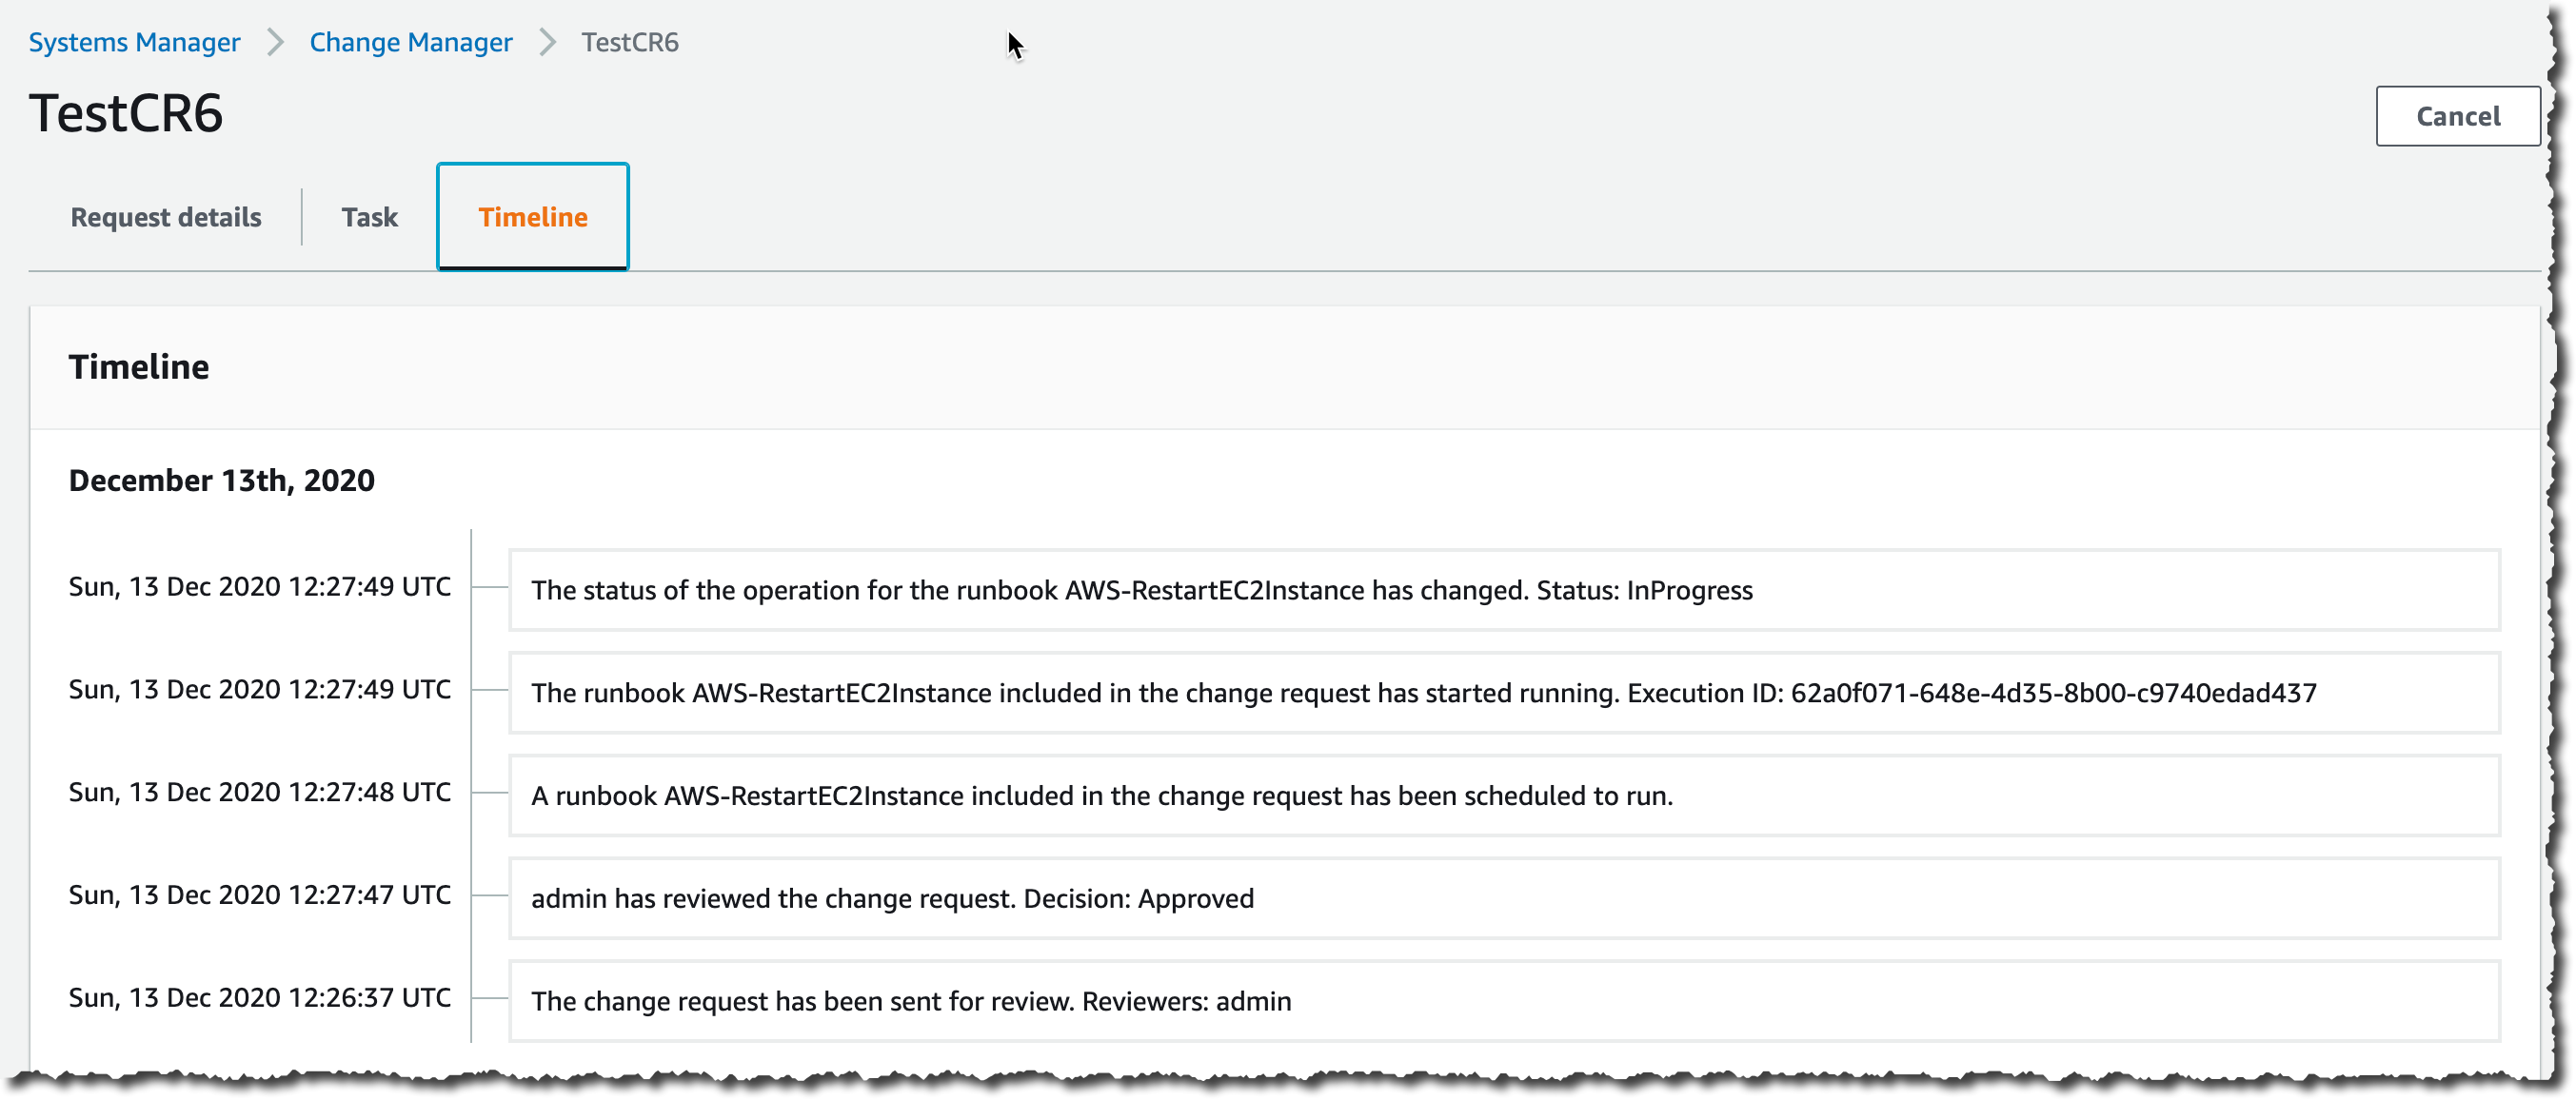
I click on the change request to see the details. In particular, the Timeline tab shows the history of this CR.

Change Management CR Timeline

Availability and Pricing
AWS Systems Manager Change Manager is available today in all commercial AWS Regions, except mainland China. The pricing is based on two dimensions: the number of change requests you submit and the total number of API calls made. The number of change requests you submit will be the main cost factor. We will charge $0.29 per change request. Check the pricing page for more details.

You can evaluate Change Manager for free for 30 days, starting on your first change request.

As usual, let us know what you think and let’s get started today

-- seb Via AWS News Blog https://ift.tt/1EusYcK
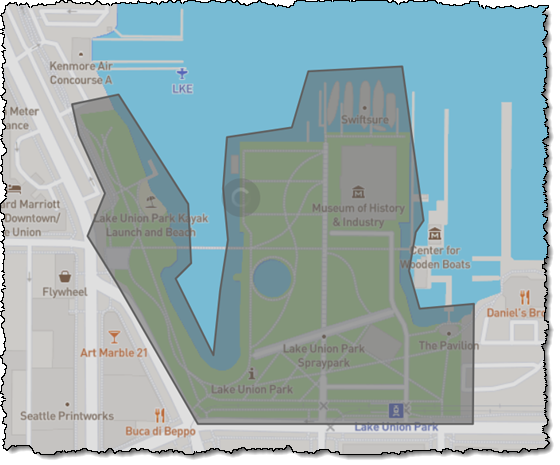
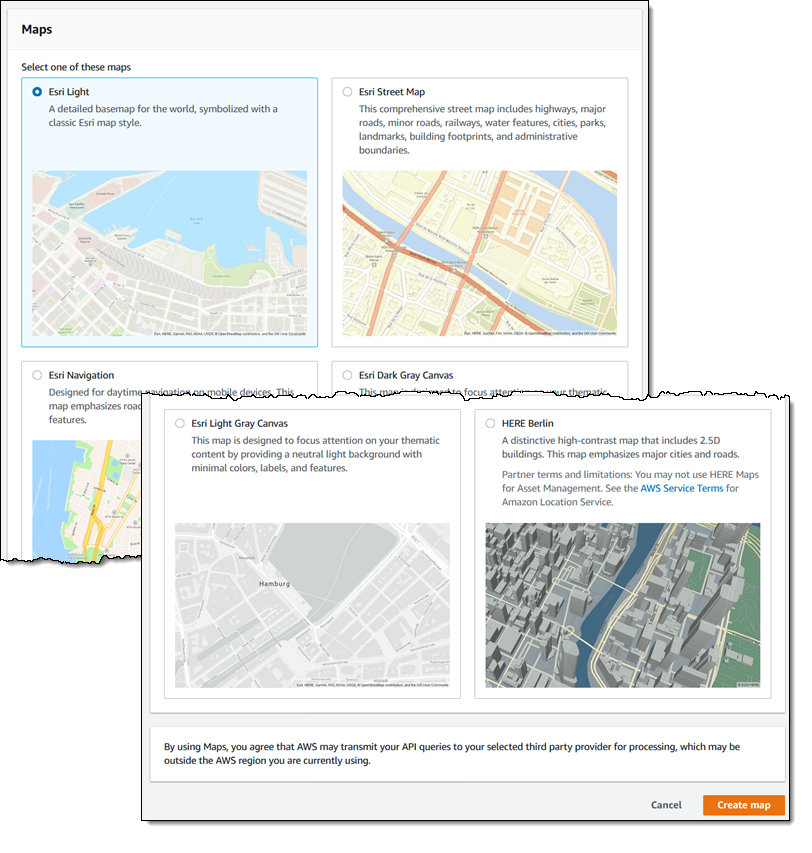