Tuesday, June 30, 2020

AWS App2Container – A New Containerizing Tool for Java and .NET Applications

Our customers are increasingly developing their new applications with containers and serverless technologies, and are using modern continuous integration and delivery (CI/CD) tools to automate the software delivery life cycle. They also maintain a large number of existing applications that are built and managed manually or using legacy systems. Maintaining these two sets of applications with disparate tooling adds to operational overhead and slows down the pace of delivering new business capabilities. As much as possible, they want to be able to standardize their management tooling and CI/CD processes across both their existing and new applications, and see the option of packaging their existing applications into containers as the first step towards accomplishing that goal.

However, containerizing existing applications requires a long list of manual tasks such as identifying application dependencies, writing dockerfiles, and setting up build and deployment processes for each application. These manual tasks are time consuming, error prone, and can slow down the modernization efforts.

Today, we are launching AWS App2Container, a new command-line tool that helps containerize existing applications that are running on-premises, in Amazon Elastic Compute Cloud (EC2), or in other clouds, without needing any code changes. App2Container discovers applications running on a server, identifies their dependencies, and generates relevant artifacts for seamless deployment to Amazon ECS and Amazon EKS. It also provides integration with AWS CodeBuild and AWS CodeDeploy to enable a repeatable way to build and deploy containerized applications.

AWS App2Container generates the following artifacts for each application component: Application artifacts such as application files/folders, Dockerfiles, container images in Amazon Elastic Container Registry (ECR), ECS Task definitions, Kubernetes deployment YAML, CloudFormation templates to deploy the application to Amazon ECS or EKS, and templates to set up a build/release pipeline in AWS Codepipeline which also leverages AWS CodeBuild and CodeDeploy.

Starting today, you can use App2Container to containerize ASP.NET (.NET 3.5+) web applications running in IIS 7.5+ on Windows, and Java applications running on Linux—standalone JBoss, Apache Tomcat, and generic Java applications such as Spring Boot, IBM WebSphere, Oracle WebLogic, etc.

By modernizing existing applications using containers, you can make them portable, increase development agility, standardize your CI/CD processes, and reduce operational costs. Now let’s see how it works!

AWS App2Container – Getting Started
AWS App2Container requires that the following prerequisites be installed on the server(s) hosting your application: AWS Command Line Interface (CLI) version 1.14 or later, Docker tools, and (in the case of ASP.NET) Powershell 5.0+ for applications running on Windows. Additionally, you need to provide appropriate IAM permissions to App2Container to interact with AWS services.

For example, let’s look how you containerize your existing Java applications. App2Container CLI for Linux is packaged as a tar.gz archive. The file provides users an interactive shell script, install.sh to install the App2Container CLI. Running the script guides users through the install steps and also updates the user’s path to include the App2Container CLI commands.

First, you can begin by running a one-time initialization on the installed server for the App2Container CLI with the init command.

$ sudo app2container init
Workspace directory path for artifacts[default:  /home/ubuntu/app2container/ws]:
AWS Profile (configured using 'aws configure --profile')[default: default]:  
Optional S3 bucket for application artifacts (Optional)[default: none]: 
Report usage metrics to AWS? (Y/N)[default: y]:
Require images to be signed using Docker Content Trust (DCT)? (Y/N)[default: n]:
Configuration saved

This sets up a workspace to store application containerization artifacts (minimum 20GB of disk space available). You can extract them into your Amazon Simple Storage Service (S3) bucket using your AWS profile configured to use AWS services.

Next, you can view Java processes that are running on the application server by using the inventory command. Each Java application process has a unique identifier (for example, java-tomcat-9e8e4799) which is the application ID. You can use this ID to refer to the application with other App2Container CLI commands.

$ sudo app2container inventory
{
    "java-jboss-5bbe0bec": {
        "processId": 27366,
        "cmdline": "java ... /home/ubuntu/wildfly-10.1.0.Final/modules org.jboss.as.standalone -Djboss.home.dir=/home/ubuntu/wildfly-10.1.0.Final -Djboss.server.base.dir=/home/ubuntu/wildfly-10.1.0.Final/standalone ",
        "applicationType": "java-jboss"
    },
    "java-tomcat-9e8e4799": {
        "processId": 2537,
        "cmdline": "/usr/bin/java ... -Dcatalina.home=/home/ubuntu/tomee/apache-tomee-plume-7.1.1 -Djava.io.tmpdir=/home/ubuntu/tomee/apache-tomee-plume-7.1.1/temp org.apache.catalina.startup.Bootstrap start ",
        "applicationType": "java-tomcat"
    }
}

You can also intialize ASP.NET applications on an administrator-run PowerShell session of Windows Servers with IIS version 7.0 or later. Note that Docker tools and container support are available on Windows Server 2016 and later versions. You can select to run all app2container operations on the application server with Docker tools installed or use a worker machine with Docker tools using Amazon ECS-optimized Windows Server AMIs.

PS> app2container inventory
{
    "iis-smarts-51d2dbf8": {
        "siteName": "nopCommerce39",
        "bindings": "http/*:90:",
        "applicationType": "iis"
    }
}

The inventory command displays all IIS websites on the application server that can be containerized. Each IIS website process has a unique identifier (for example, iis-smarts-51d2dbf8) which is the application ID. You can use this ID to refer to the application with other App2Container CLI commands.

You can choose a specific application by referring to its application ID and generate an analysis report for the application by using the analyze command.

$ sudo app2container analyze --application-id java-tomcat-9e8e4799
Created artifacts folder /home/ubuntu/app2container/ws/java-tomcat-9e8e4799
Generated analysis data in /home/ubuntu/app2container/ws/java-tomcat-9e8e4799/analysis.json
Analysis successful for application java-tomcat-9e8e4799
Please examine the same, make appropriate edits and initiate containerization using "app2container containerize --application-id java-tomcat-9e8e4799"

You can use the analysis.json template generated by the application analysis to gather information on the analyzed application that helps identify all system dependencies from the analysisInfo section, and update containerization parameters to customize the container images generated for the application using the containerParameters section.

$ cat java-tomcat-9e8e4799/analysis.json
{
    "a2CTemplateVersion": "1.0",
        "createdTime": "2020-06-24 07:40:5424",
    "containerParameters": {
        "_comment1": "*** EDITABLE: The below section can be edited according to the application requirements. Please see the analyisInfo section below for deetails discoverd regarding the application. ***",
        "imageRepository": "java-tomcat-9e8e4799",
        "imageTag": "latest",
        "containerBaseImage": "ubuntu:18.04",
        "coopProcesses": [ 6446, 6549, 6646]
    },
    "analysisInfo": {
        "_comment2": "*** NON-EDITABLE: Analysis Results ***",
        "processId": 2537
        "appId": "java-tomcat-9e8e4799",
                "userId": "1000",
        "groupId": "1000",
        "cmdline": [...],
        "os": {...},
        "ports": [...]
    }
}

Also, you can run the $ app2container extract --application-id java-tomcat-9e8e4799 command to generate an application archive for the analyzed application. This depends on the analysis.json file generated earlier in the workspace folder for the application,and adheres to any containerization parameter updates specified in there. By using extract command, you can continue the workflow on a worker machine after running the first set of commands on the application server.

Now you can containerize command generated Docker images for the selected application.

$ sudo app2container containerize --application-id java-tomcat-9e8e4799
AWS pre-requisite check succeeded
Docker pre-requisite check succeeded
Extracted container artifacts for application
Entry file generated
Dockerfile generated under /home/ubuntu/app2container/ws/java-tomcat-9e8e4799/Artifacts
Generated dockerfile.update under /home/ubuntu/app2container/ws/java-tomcat-9e8e4799/Artifacts
Generated deployment file at /home/ubuntu/app2container/ws/java-tomcat-9e8e4799/deployment.json
Containerization successful. Generated docker image java-tomcat-9e8e4799
You're all set to test and deploy your container image.

Next Steps:
1. View the container image with \"docker images\" and test the application.
2. When you're ready to deploy to AWS, please edit the deployment file as needed at /home/ubuntu/app2container/ws/java-tomcat-9e8e4799/deployment.json.
3. Generate deployment artifacts using app2container generate app-deployment --application-id java-tomcat-9e8e4799

Using this command, you can view the generated container images using Docker images on the machine where the containerize command is run. You can use the docker run command to launch the container and test application functionality.

Note that in addition to generating container images, the containerize command also generates a deployment.json template file that you can use with the next generate-appdeployment command. You can edit the parameters in the deployment.json template file to change the image repository name to be registered in Amazon ECR, the ECS task definition parameters, or the Kubernetes App name.

$ cat java-tomcat-9e8e4799/deployment.json
{
       "a2CTemplateVersion": "1.0",
       "applicationId": "java-tomcat-9e8e4799",
       "imageName": "java-tomcat-9e8e4799",
       "exposedPorts": [
              {
                     "localPort": 8090,
                     "protocol": "tcp6"
              }
       ],
       "environment": [],
       "ecrParameters": {
              "ecrRepoTag": "latest"
       },
       "ecsParameters": {
              "createEcsArtifacts": true,
              "ecsFamily": "java-tomcat-9e8e4799",
              "cpu": 2,
              "memory": 4096,
              "dockerSecurityOption": "",
              "enableCloudwatchLogging": false,
              "publicApp": true,
              "stackName": "a2c-java-tomcat-9e8e4799-ECS",
              "reuseResources": {
                     "vpcId": "",
                     "cfnStackName": "",
                     "sshKeyPairName": ""
              },
              "gMSAParameters": {
                     "domainSecretsArn": "",
                     "domainDNSName": "",
                     "domainNetBIOSName": "",
                     "createGMSA": false,
                     "gMSAName": ""
              }
       },
       "eksParameters": {
              "createEksArtifacts": false,
              "applicationName": "",
              "stackName": "a2c-java-tomcat-9e8e4799-EKS",
              "reuseResources": {
                     "vpcId": "",
                     "cfnStackName": "",
                     "sshKeyPairName": ""
              }
       }
 }

At this point, the application workspace where the artifacts are generated serves as an iteration sandbox. You can choose to edit the Dockerfile generated here to make changes to their application and use the docker build command to build new container images as needed. You can generate the artifacts needed to deploy the application containers in Amazon EKS by using the generate-deployment command.

$ sudo app2container generate app-deployment --application-id java-tomcat-9e8e4799
AWS pre-requisite check succeeded
Docker pre-requisite check succeeded
Created ECR Repository
Uploaded Cloud Formation resources to S3 Bucket: none
Generated Cloud Formation Master template at: /home/ubuntu/app2container/ws/java-tomcat-9e8e4799/EksDeployment/amazon-eks-master.template.yaml
EKS Cloudformation templates and additional deployment artifacts generated successfully for application java-tomcat-9e8e4799

You're all set to use AWS Cloudformation to manage your application stack.
Next Steps:
1. Edit the cloudformation template as necessary.
2. Create an application stack using the AWS CLI or the AWS Console. AWS CLI command:

       aws cloudformation deploy --template-file /home/ubuntu/app2container/ws/java-tomcat-9e8e4799/EksDeployment/amazon-eks-master.template.yaml --capabilities CAPABILITY_NAMED_IAM --stack-name java-tomcat-9e8e4799

3. Setup a pipeline for your application stack:

       app2container generate pipeline --application-id java-tomcat-9e8e4799

This command works based on the deployment.json template file produced as part of running the containerize command. App2Container will now generate ECS/EKS cloudformation templates as well and an option to deploy those stacks.

The command registers the container image to user specified ECR repository, generates cloudformation template for Amazon ECS and EKS deployments. You can register ECS task definition with Amazon ECS and use kubectl to launch the containerized application on the existing Amazon EKS or self-managed kubernetes cluster using App2Container generated amazon-eks-master.template.deployment.yaml.

Alternatively, you can directly deploy containerized applications by --deploy options into Amazon EKS.

$ sudo app2container generate app-deployment --application-id java-tomcat-9e8e4799 --deploy
AWS pre-requisite check succeeded
Docker pre-requisite check succeeded
Created ECR Repository
Uploaded Cloud Formation resources to S3 Bucket: none
Generated Cloud Formation Master template at: /home/ubuntu/app2container/ws/java-tomcat-9e8e4799/EksDeployment/amazon-eks-master.template.yaml
Initiated Cloudformation stack creation. This may take a few minutes. Please visit the AWS Cloudformation Console to track progress.
Deploying application to EKS

Handling ASP.NET Applications with Windows Authentication
Containerizing ASP.NET applications is almost same process as Java applications, but Windows containers cannot be directly domain joined. They can however still use Active Directory (AD) domain identities to support various authentication scenarios.

App2Container detects if a site is using Windows authentication and accordingly makes the IIS site’s application pool run as the network service identity, and generates the new cloudformation templates for Windows authenticated IIS applications. The creation of gMSA and AD Security group, domain join ECS nodes and making containers use this gMSA are all taken care of by those templates.

Also, it provides two PowerShell scripts as output to the $ app2container containerize command along with an instruction file on how to use it.

The following is an example output:

PS C:\Windows\system32> app2container containerize --application-id iis-SmartStoreNET-a726ba0b
Running AWS pre-requisite check...
Running Docker pre-requisite check...
Container build complete. Please use "docker images" to view the generated container images.
Detected that the Site is using Windows Authentication.
Generating powershell scripts into C:\Users\Admin\AppData\Local\app2container\iis-SmartStoreNET-a726ba0b\Artifacts required to setup Container host with Windows Authentication
Please look at C:\Users\Admin\AppData\Local\app2container\iis-SmartStoreNET-a726ba0b\Artifacts\WindowsAuthSetupInstructions.md for setup instructions on Windows Authentication.
A deployment file has been generated under C:\Users\Admin\AppData\Local\app2container\iis-SmartStoreNET-a726ba0b
Please edit the same as needed and generate deployment artifacts using "app2container generate-deployment"

The first PowerShellscript, DomainJoinAddToSecGroup.ps1, joins the container host and adds it to an Active Directory security group. The second script, CreateCredSpecFile.ps1, creates a Group Managed Service Account (gMSA), grants access to the Active Directory security group, generates the credential spec for this gMSA, and stores it locally on the container host. You can execute these PowerShellscripts on the ECS host. The following is an example usage of the scripts:

PS C:\Windows\system32> .\DomainJoinAddToSecGroup.ps1 -ADDomainName Dominion.com -ADDNSIp 10.0.0.1 -ADSecurityGroup myIISContainerHosts -CreateADSecurityGroup:$true
PS C:\Windows\system32> .\CreateCredSpecFile.ps1 -GMSAName MyGMSAForIIS -CreateGMSA:$true -ADSecurityGroup myIISContainerHosts

Before executing the app2container generate-deployment command, edit the deployment.json file to change the value of dockerSecurityOption to the name of the CredentialSpec file that the CreateCredSpecFile script generated. For example,
"dockerSecurityOption": "credentialspec:file://dominion_mygmsaforiis.json"

Effectively, any access to network resource made by the IIS server inside the container for the site will now use the above gMSA to authenticate. The final step is to authorize this gMSA account on the network resources that the IIS server will access. A common example is authorizing this gMSA inside the SQL Server.

Finally, if the application must connect to a database to be fully functional and you run the container in Amazon ECS, ensure that the application container created from the Docker image generated by the tool has connectivity to the same database. You can refer to this documentation for options on migrating: MS SQL Server from Windows to Linux on AWS, Database Migration Service, and backup and restore your MS SQL Server to Amazon RDS.

Now Available
AWS App2Container is offered free. You only pay for the actual usage of AWS services like Amazon EC2, ECS, EKS, and S3 etc based on their usage. For details, please refer to App2Container FAQs and documentations. Give this a try, and please send us feedback either through your usual AWS Support contacts, on the AWS Forum for ECS, AWS Forum for EKS, or on the container roadmap on Github.

Channy;

Via AWS News Blog https://ift.tt/1EusYcK

Amazon RDS Proxy – Now Generally Available

At AWS re:Invent 2019, we launched the preview of Amazon RDS Proxy, a fully managed, highly available database proxy for Amazon Relational Database Service (RDS) that makes applications more scalable, more resilient to database failures, and more secure. Following the preview of MySQL engine, we extended to the PostgreSQL compatibility. Today, I am pleased to announce that we are now generally available for both engines.

Many applications, including those built on modern serverless architectures using AWS Lambda, Fargate, Amazon ECS, or EKS can have a large number of open connections to the database server, and may open and close database connections at a high rate, exhausting database memory and compute resources.

Amazon RDS Proxy allows applications to pool and share connections established with the database, improving database efficiency, application scalability, and security. With RDS Proxy, failover times for Amazon Aurora and RDS databases are reduced by up to 66%, and database credentials, authentication, and access can be managed through integration with AWS Secrets Manager and AWS Identity and Access Management (IAM).

Amazon RDS Proxy can be enabled for most applications with no code change, and you don’t need to provision or manage any additional infrastructure and only pay per vCPU of the database instance for which the proxy is enabled.

Amazon RDS Proxy – Getting started
You can get started with Amazon RDS Proxy in just a few clicks by going to the AWS management console and creating an RDS Proxy endpoint for your RDS databases. In the navigation pane, choose Proxies and Create proxy. You can also see the proxy panel below.

To create your proxy, specify the Proxy identifier, a unique name of your choosing, and choose the database engine – either MySQL or PostgreSQL. Choose the encryption setting if you want the proxy to enforce TLS / SSL for all connection between application and proxy, and specify a time period that a client connection can be idle before the proxy can close it.

A client connection is considered idle when the application doesn’t submit a new request within the specified time after the previous request completed. The underlying connection between the proxy and database stays open and is returned to the connection pool. Thus, it’s available to be reused for new client connections.

Next, choose one RDS DB instance or Aurora DB cluster in Database to access through this proxy. The list only includes DB instances and clusters with compatible database engines, engine versions, and other settings.

Specify Connection pool maximum connections, a value between 1 and 100. This setting represents the percentage of the max_connections value that RDS Proxy can use for its connections. If you only intend to use one proxy with this DB instance or cluster, you can set it to 100. For details about how RDS Proxy uses this setting, see Connection Limits and Timeouts.

Choose at least one Secrets Manager secret associated with the RDS DB instance or Aurora DB cluster that you intend to access with this proxy, and select an IAM role that has permission to access the Secrets Manager secrets you chose. If you don’t have an existing secret, please click Create a new secret before setting up the RDS proxy.

After setting VPC Subnets and a security group, please click Create proxy. If you more settings in details, please refer to the documentation.

You can see the new RDS proxy after waiting a few minutes and then point your application to the RDS Proxy endpoint. That’s it!

You can also create an RDS proxy easily via AWS CLI command.

aws rds create-db-proxy \
    --db-proxy-name channy-proxy \
    --role-arn iam_role \
    --engine-family { MYSQL|POSTGRESQL } \
    --vpc-subnet-ids space_separated_list \
    [--vpc-security-group-ids space_separated_list] \
    [--auth ProxyAuthenticationConfig_JSON_string] \
    [--require-tls | --no-require-tls] \
    [--idle-client-timeout value] \
    [--debug-logging | --no-debug-logging] \
    [--tags comma_separated_list]

How RDS Proxy works
Let’s see an example that demonstrates how open connections continue working during a failover when you reboot a database or it becomes unavailable due to a problem. This example uses a proxy named channy-proxy and an Aurora DB cluster with DB instances instance-8898 and instance-9814. When the failover-db-cluster command is run from the Linux command line, the writer instance that the proxy is connected to changes to a different DB instance. You can see that the DB instance associated with the proxy changes while the connection remains open.

$ mysql -h channy-proxy.proxy-abcdef123.us-east-1.rds.amazonaws.com -u admin_user -p
Enter password:
...
mysql> select @@aurora_server_id;
+--------------------+
| @@aurora_server_id |
+--------------------+
| instance-9814 |
+--------------------+
1 row in set (0.01 sec)

mysql>
[1]+ Stopped mysql -h channy-proxy.proxy-abcdef123.us-east-1.rds.amazonaws.com -u admin_user -p
$ # Initially, instance-9814 is the writer.
$ aws rds failover-db-cluster --db-cluster-id cluster-56-2019-11-14-1399
JSON output
$ # After a short time, the console shows that the failover operation is complete.
$ # Now instance-8898 is the writer.
$ fg
mysql -h channy-proxy.proxy-abcdef123.us-east-1.rds.amazonaws.com -u admin_user -p

mysql> select @@aurora_server_id;
+--------------------+
| @@aurora_server_id |
+--------------------+
| instance-8898 |
+--------------------+
1 row in set (0.01 sec)

mysql>
[1]+ Stopped mysql -h channy-proxy.proxy-abcdef123.us-east-1.rds.amazonaws.com -u admin_user -p
$ aws rds failover-db-cluster --db-cluster-id cluster-56-2019-11-14-1399
JSON output
$ # After a short time, the console shows that the failover operation is complete.
$ # Now instance-9814 is the writer again.
$ fg
mysql -h channy-proxy.proxy-abcdef123.us-east-1.rds.amazonaws.com -u admin_user -p

mysql> select @@aurora_server_id;
+--------------------+
| @@aurora_server_id |
+--------------------+
| instance-9814 |
+--------------------+
1 row in set (0.01 sec)
+---------------+---------------+
| Variable_name | Value |
+---------------+---------------+
| hostname | ip-10-1-3-178 |
+---------------+---------------+
1 row in set (0.02 sec)

With RDS Proxy, you can build applications that can transparently tolerate database failures without needing to write complex failure handling code. RDS Proxy automatically routes traffic to a new database instance while preserving application connections.

You can review the demo for an overview of RDS Proxy and the steps you need take to access RDS Proxy from a Lambda function.

If you want to know how your serverless applications maintain excellent performance even at peak loads, please read this blog post. For a deeper dive into using RDS Proxy for MySQL with serverless, visit this post.

The following are a few things that you should be aware of:

  • Currently, RDS Proxy is available for the MySQL and PostgreSQL engine family. This engine family includes RDS for MySQL 5.6 and 5.7, PostgreSQL 10.11 and 11.5.
  • In an Aurora cluster, all of the connections in the connection pool are handled by the Aurora primary instance. To perform load balancing for read-intensive workloads, you still use the reader endpoint directly for the Aurora cluster.
  • Your RDS Proxy must be in the same VPC as the database. Although the database can be publicly accessible, the proxy can’t be.
  • Proxies don’t support compressed mode. For example, they don’t support the compression used by the --compress or -C options of the mysql command.

Now Available!
Amazon RDS Proxy is generally available in US East (N. Virginia), US East (Ohio), US West (N. California), US West (Oregon), Europe (Frankfurt), Europe (Ireland), Europe (London) , Asia Pacific (Mumbai), Asia Pacific (Seoul), Asia Pacific (Singapore), Asia Pacific (Sydney) and Asia Pacific (Tokyo) regions for Aurora MySQL, RDS for MySQL, Aurora PostgreSQL, and RDS for PostgreSQL, and it includes support for Aurora Serverless and Aurora Multi-Master.

Take a look at the product page, pricing, and the documentation to learn more. Please send us feedback either in the AWS forum for Amazon RDS or through your usual AWS support contacts.

Channy;

Via AWS News Blog https://ift.tt/1EusYcK

3 things the pandemic taught us about cloud computing

We’re in a recovery now, and at some point, things will be back to near normal…hopefully. We learned that some businesses fared better than others during the upheaval. Nine times out of ten, those businesses leveraged cloud successfully to navigate the quick IT changes needed during the pandemic.

Many enterprises have learned some hard lessons. Indeed, I suspect more will come. Enterprises discovered more about the advantages and limitations of cloud computing in the last four months than in the previous two years. Here are three of the big ones I see consistently:

Cloudops is more important than we thought. Cloud operations has been an afterthought for many enterprises, even post-deployment. Most IT organizations gave it some attention, but cloudops best practices and use of technology have been limited by small budgets and a general lack of understanding. During the pandemic the chickens came home to roost.

To read this article in full, please click here

Monday, June 29, 2020

Find Your Most Expensive Lines of Code – Amazon CodeGuru Is Now Generally Available

Bringing new applications into production, maintaining their code base as they grow and evolve, and at the same time respond to operational issues, is a challenging task. For this reason, you can find many ideas on how to structure your teams, on which methodologies to apply, and how to safely automate your software delivery pipeline.

At re:Invent last year, we introduced in preview Amazon CodeGuru, a developer tool powered by machine learning that helps you improve your applications and troubleshoot issues with automated code reviews and performance recommendations based on runtime data. During the last few months, many improvements have been launched, including a more cost-effective pricing model, support for Bitbucket repositories, and the ability to start the profiling agent using a command line switch, so that you no longer need to modify the code of your application, or add dependencies, to run the agent.

You can use CodeGuru in two ways:

  • CodeGuru Reviewer uses program analysis and machine learning to detect potential defects that are difficult for developers to find, and recommends fixes in your Java code. The code can be stored in GitHub (now also in GitHub Enterprise), AWS CodeCommit, or Bitbucket repositories. When you submit a pull request on a repository that is associated with CodeGuru Reviewer, it provides recommendations for how to improve your code. Each pull request corresponds to a code review, and each code review can include multiple recommendations that appear as comments on the pull request.
  • CodeGuru Profiler provides interactive visualizations and recommendations that help you fine-tune your application performance and troubleshoot operational issues using runtime data from your live applications. It currently supports applications written in Java virtual machine (JVM) languages such as Java, Scala, Kotlin, Groovy, Jython, JRuby, and Clojure. CodeGuru Profiler can help you find the most expensive lines of code, in terms of CPU usage or introduced latency, and suggest ways you can improve efficiency and remove bottlenecks. You can use CodeGuru Profiler in production, and when you test your application with a meaningful workload, for example in a pre-production environment.

Today, Amazon CodeGuru is generally available with the addition of many new features.

In CodeGuru Reviewer, we included the following:

  • Support for Github Enterprise – You can now scan your pull requests and get recommendations against your source code on Github Enterprise on-premises repositories, together with a description of what’s causing the issue and how to remediate it.
  • New types of recommendations to solve defects and improve your code – For example, checking input validation, to avoid issues that can compromise security and performance, and looking for multiple copies of code that do the same thing.

In CodeGuru Profiler, you can find these new capabilities:

  • Anomaly detection – We automatically detect anomalies in the application profile for those methods that represent the highest proportion of CPU time or latency.
  • Lambda function support – You can now profile AWS Lambda functions just like applications hosted on Amazon Elastic Compute Cloud (EC2) and containerized applications running on Amazon ECS and Amazon Elastic Kubernetes Service, including those using AWS Fargate.
  • Cost of issues in the recommendation report – Recommendations contain actionable resolution steps which explain what the problem is, the CPU impact, and how to fix the issue. To help you better prioritize your activities, you now have an estimation of the savings introduced by applying the recommendation.
  • Color-my-code – In the visualizations, to help you easily find your own code, we are coloring your methods differently from frameworks and other libraries you may use.
  • CloudWatch metrics and alerts – To keep track and monitor efficiency issues that have been discovered.

Let’s see some of these new features at work!

Using CodeGuru Reviewer with a Lambda Function
I create a new repo in my GitHub account, and leave it empty for now. Locally, where I am developing a Lambda function using the Java 11 runtime, I initialize my Git repo and add only the README.md file to the master branch. In this way, I can add all the code as a pull request later and have it go through a code review by CodeGuru.

git init
git add README.md
git commit -m "First commit"

Now, I add the GitHub repo as origin, and push my changes to the new repo:

git remote add origin https://github.com/<my-user-id>/amazon-codeguru-sample-lambda-function.git
git push -u origin master

I associate the repository in the CodeGuru console:

When the repository is associated, I create a new dev branch, add all my local files to it, and push it remotely:

git checkout -b dev
git add .
git commit -m "Code added to the dev branch"
git push --set-upstream origin dev

In the GitHub console, I open a new pull request by comparing changes across the two branches, master and dev. I verify that the pull request is able to merge, then I create it.

Since the repository is associated with CodeGuru, a code review is listed as Pending in the Code reviews section of the CodeGuru console.

After a few minutes, the code review status is Completed, and CodeGuru Reviewer issues a recommendation on the same GitHub page where the pull request was created.

Oops! I am creating the Amazon DynamoDB service object inside the function invocation method. In this way, it cannot be reused across invocations. This is not efficient.

To improve the performance of my Lambda function, I follow the CodeGuru recommendation, and move the declaration of the DynamoDB service object to a static final attribute of the Java application object, so that it is instantiated only once, during function initialization. Then, I follow the link in the recommendation to learn more best practices for working with Lambda functions.

Using CodeGuru Profiler with a Lambda Function
In the CodeGuru console, I create a MyServerlessApp-Development profiling group and select the Lambda compute platform.

Next, I give the AWS Identity and Access Management (IAM) role used by my Lambda function permissions to submit data to this profiling group.

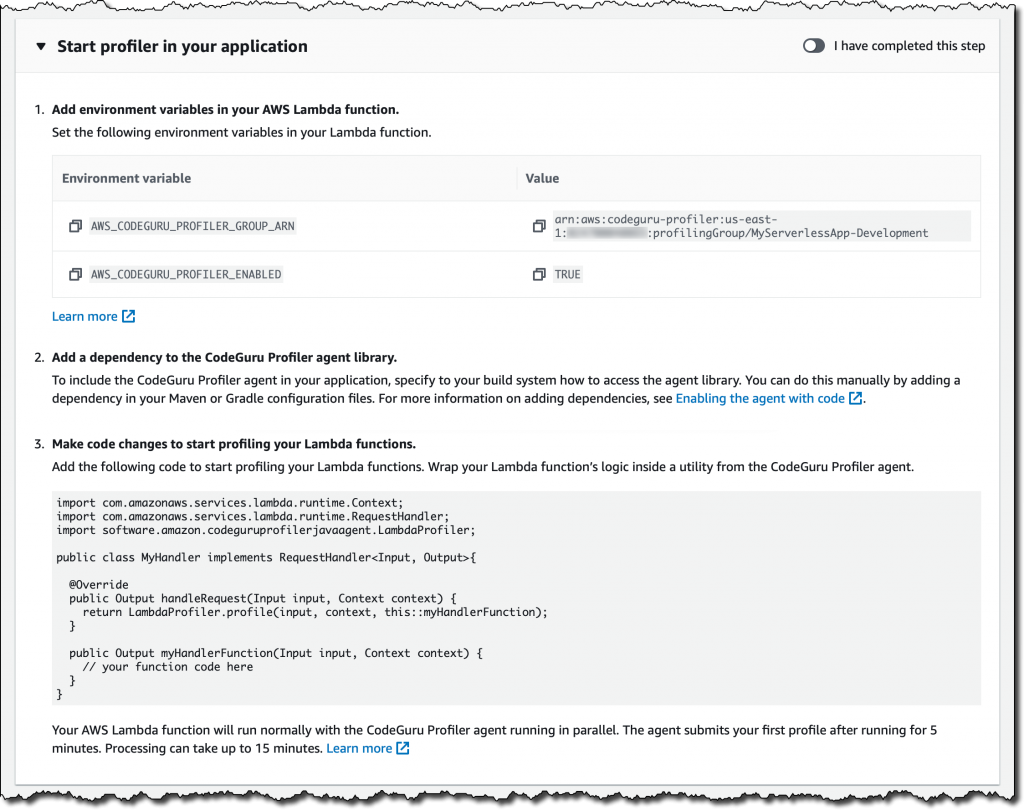
Now, the console is giving me all the info I need to profile my Lambda function. To configure the profiling agent, I use a couple of environment variables:

  • AWS_CODEGURU_PROFILER_GROUP_ARN to specify the ARN of the profiling group to use.
  • AWS_CODEGURU_PROFILER_ENABLED to enable (TRUE) or disable (FALSE) profiling.

I follow the instructions (for Maven and Gradle) to add a dependency, and include the profiling agent in the build. Then, I update the code of the Lambda function to wrap the handler function inside the LambdaProfiler provided by the agent.

To generate some load, I start a few scripts invoking my function using the Amazon API Gateway as trigger. After a few minutes, the profiling group starts to show visualizations describing the runtime behavior of my Lambda function.

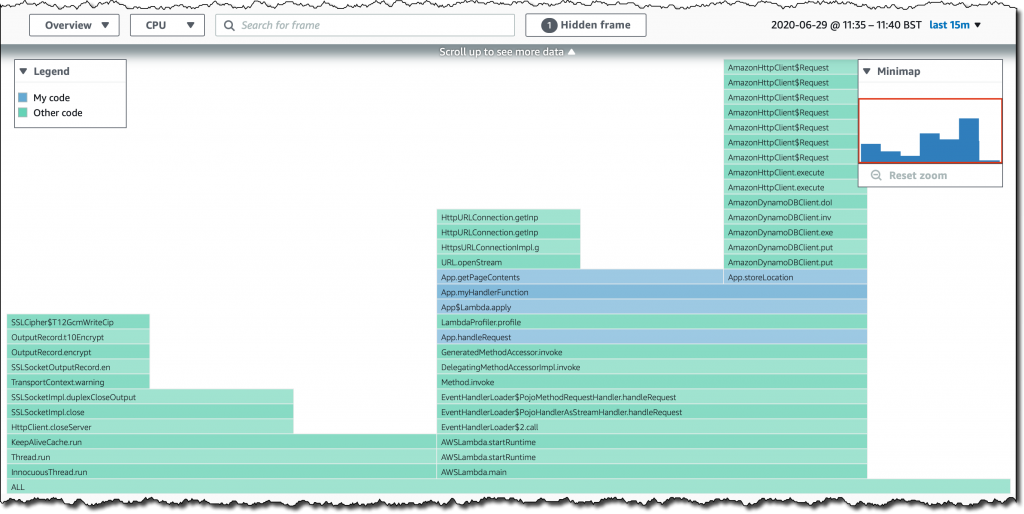
For example, I can see how much CPU time is spent in the different methods of my function. At the bottom, there are the entry point methods. As I scroll up, I find methods that are called deeper in the stack trace. I right-click and hide the LambdaRuntimeClient methods to focus on my code. Note that my methods are colored differently than those in the packages I am using, such as the AWS SDK for Java.

I am mostly interested in what happens in the handler method invoked by the Lambda platform. I select the handler method, and now it becomes the new “base” of the visualization.

As I move my pointer on each of my methods, I get more information, including an estimation of the yearly cost of running that specific part of the code in production, based on the load experienced by the profiling agent during the selected time window. In my case, the handler function cost is estimated to be $6. If I select the two main functions above, I have an estimation of $3 each. The cost estimation works for code running on Lambda functions, EC2 instances, and containerized applications.

Similarly, I can visualize Latency, to understand how much time is spent inside the methods in my code. I keep the Lambda function handler method selected to drill down into what is under my control, and see where time is being spent the most.

The CodeGuru Profiler is also providing a recommendation based on the data collected. I am spending too much time (more than 4%) in managing encryption. I can use a more efficient crypto provider, such as the open source Amazon Corretto Crypto Provider, described in this blog post. This should lower the time spent to what is expected, about 1% of my profile.

Finally, I edit the profiling group to enable notifications. In this way, if CodeGuru detects an anomaly in the profile of my application, I am notified in one or more Amazon Simple Notification Service (SNS) topics.

Available Now
Amazon CodeGuru is available today in 10 regions, and we are working to add more regions in the coming months. For regional availability, please see the AWS Region Table.

CodeGuru helps you improve your application code and reduce compute and infrastructure costs with an automated code reviewer and application profiler that provide intelligent recommendations. Using visualizations based on runtime data, you can quickly find the most expensive lines of code of your applications. With CodeGuru, you pay only for what you use. Pricing is based on the lines of code analyzed by CodeGuru Reviewer, and on sampling hours for CodeGuru Profiler.

To learn more, please see the documentation or check out the video by Jeff!

Danilo

Via AWS News Blog https://ift.tt/1EusYcK

Friday, June 26, 2020

Why data and processing should live in the cloud, not on devices

I’m a big fan of IEEE’s coverage of the emerging cloud computing space. The technical depth of the articles won’t tempt the average IT reader to subscribe, but I like their focus on new innovations, followed by the detailed solutions that prove the innovations—sometimes too much detail. 

I recently came across this article titled “Energy-Efficient Decision Making for Mobile Cloud Offloading.” It triggered a mental note that mobile computing devices have lived with clouds for more than 10 years. We have yet to put a stake in the ground or a best practice around the tiering of mobile device processing and data storage. Perhaps it’s time.

To read this article in full, please click here

Wednesday, June 24, 2020

Introducing Amazon Honeycode – Build Web & Mobile Apps Without Writing Code

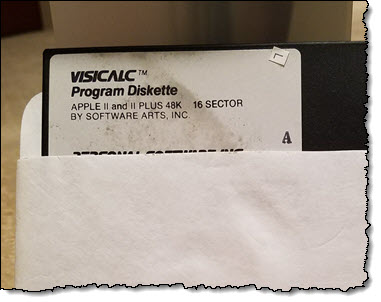
VisiCalc was launched in 1979, and I purchased a copy (shown at right) for my Apple II. The spreadsheet model was clean, easy to use, and most of all, easy to teach. I was working in a retail computer store at that time, and knew that this product was a big deal when customers started asking to purchase the software, and for whatever hardware that was needed to run it.

Today’s spreadsheets fill an important gap between mass-produced packaged applications and custom-built code created by teams of dedicated developers. Every tool has its limits, however. Sharing data across multiple users and multiple spreadsheets is difficult, as is dealing with large amounts of data. Integration & automation are also challenging, and require specialized skills. In many cases, those custom-built apps would be a better solution than a spreadsheet, but a lack of developers or other IT resources means that these apps rarely get built.

Introducing Amazon Honeycode
Today we are launching Amazon Honeycode in beta form. This new fully-managed AWS service gives you the power to build powerful mobile & web applications without writing any code. It uses the familiar spreadsheet model and lets you get started in minutes. If you or your teammates are already familiar with spreadsheets and formulas, you’ll be happy to hear that just about everything you know about sheets, tables, values, and formulas still applies.

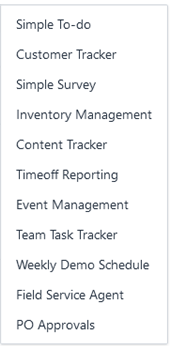
Amazon Honeycode includes templates for some common applications that you and other members of your team can use right away:

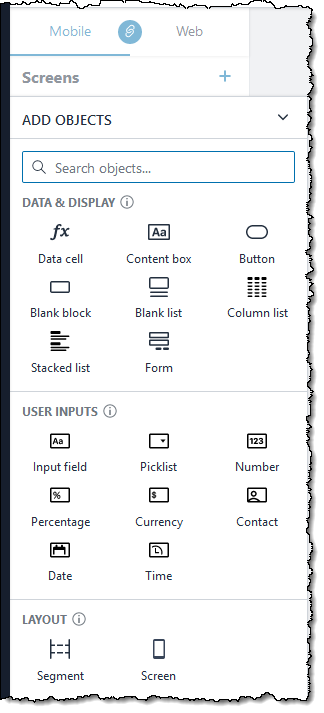
You can customize these apps at any time and the changes will be deployed immediately. You can also start with an empty table, or by importing some existing data in CSV form. The applications that you build with Honeycode can make use of a rich palette of user interface objects including lists, buttons, and input fields:

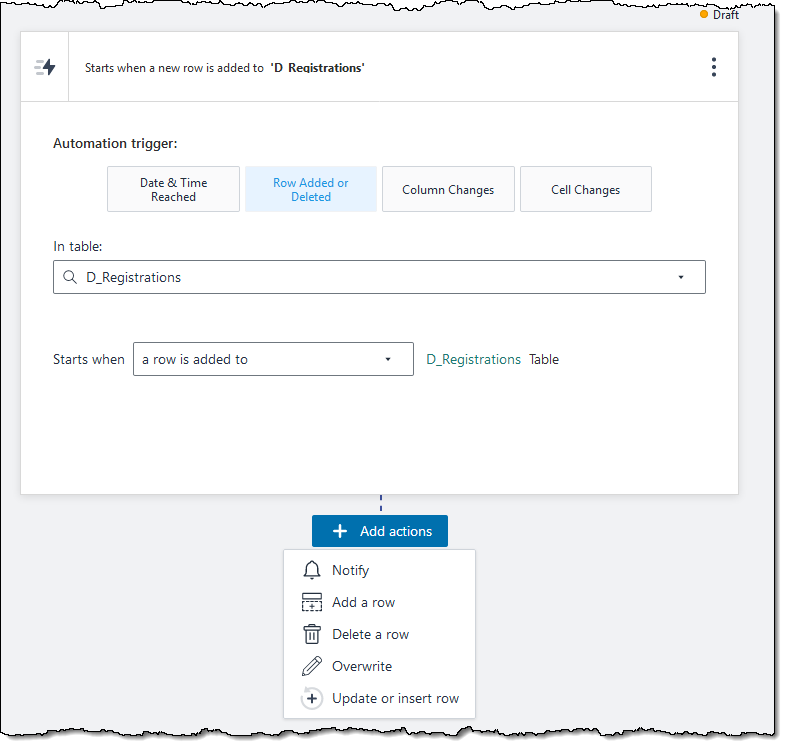
You can also take advantage of a repertoire of built-in, trigger-driven actions that can generate email notifications and modify tables:

Honeycode also includes a lengthy list of built-in functions. The list includes many functions that will be familiar to users of existing spreadsheets, along with others that are new to Honeycode. For example, FindRow is a more powerful version of the popular Vlookup function.

Getting Started with Honeycode
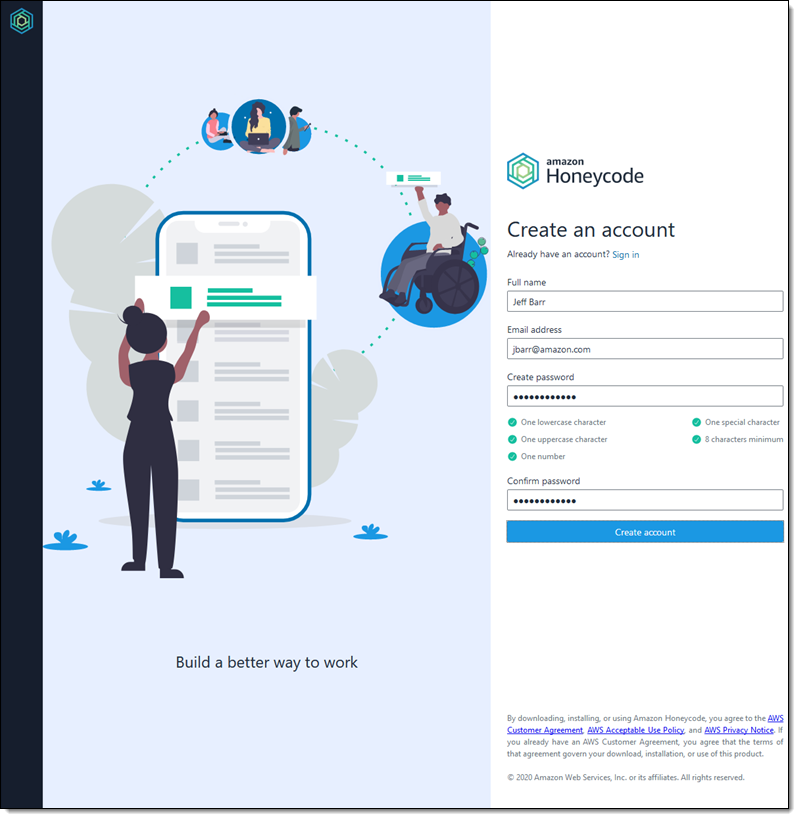
It is easy to get started. I visit the Honeycode Builder, and create my account:

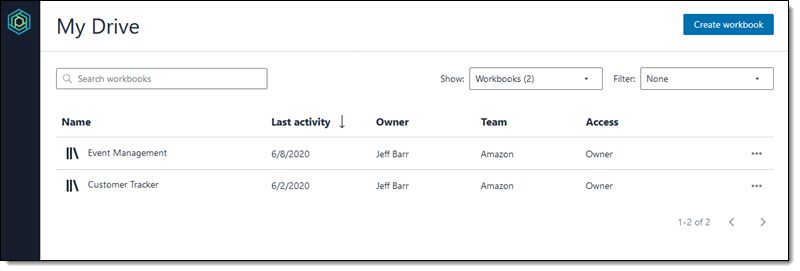
After logging in I see My Drive, with my workbooks & apps, along with multiple search, filter, & view options:

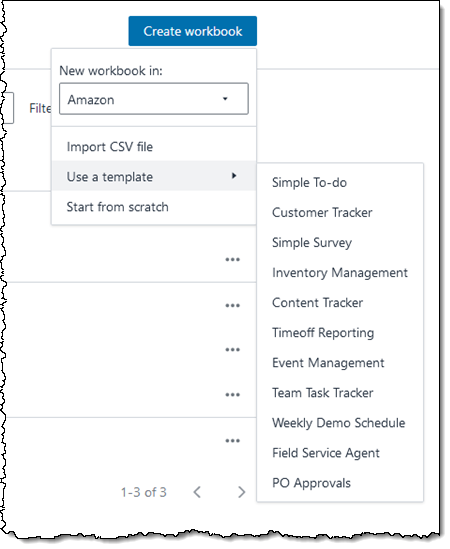
I can open & explore my existing items, or I can click Create workbook to make something new. I do that, and then select the Simple To-do template:

The workbook, tables, and the apps are created and ready to use right away. I can simply clear the sample data from the tables and share the app with the users, or I can inspect and customize it. Let’s inspect it first, and then share it!

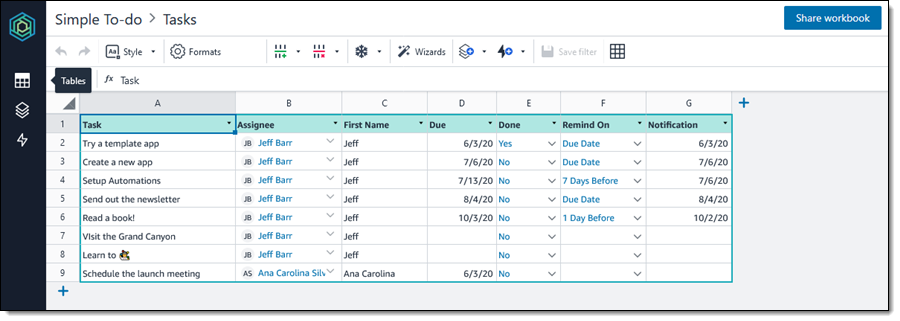
After I create the new workbook, the Tasks table is displayed and I can see the sample data:

Although this looks like a traditional spreadsheet, there’s a lot going on beneath the surface. Let’s go through, column-by-column:

A (Task) – Plain text.

B (Assignee) – Text, formatted as a Contact.

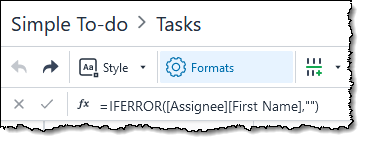
C (First Name) – Text, computed by a formula:

In the formula, Assignee refers to column B, and First Name refers to the first name of the contact.

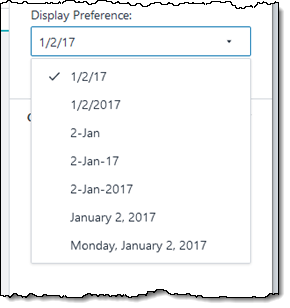
D (Due) – A date, with multiple formatting options:

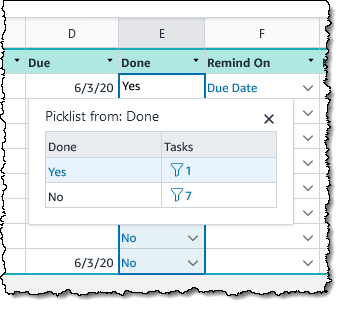
E (Done) – A picklist that pulls values from another table, and that is formatted as a Honeycode rowlink. Together, this restricts the values in this column to those found in the other table (Done, in this case, with the values Yes and No), and also makes the values from that table visible within the context of this one:

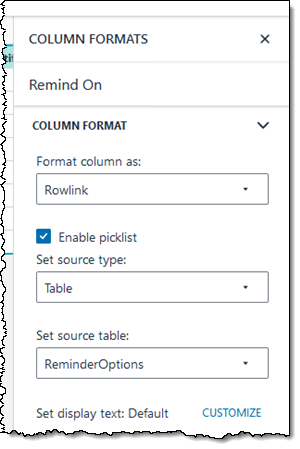
F (Remind On) – Another picklist, this one taking values from the ReminderOptions table:

G (Notification) – Another date.

This particular table uses just a few of the features and options that are available to you.

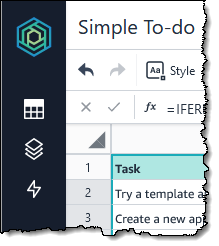
I can use the icons on the left to explore my workbook:

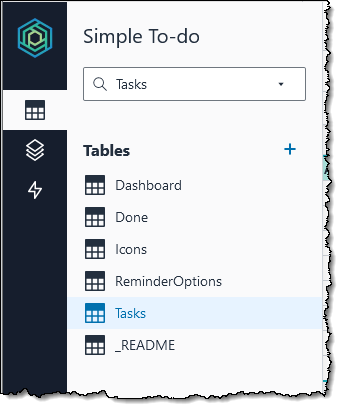
I can see the tables:

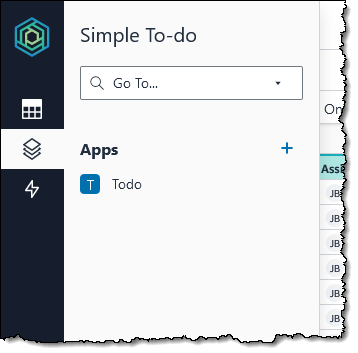
I can also see the apps. A single Honeycode workbook can contain multiple apps that make use of the same tables:

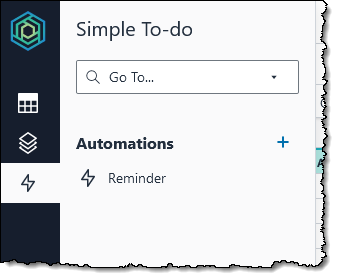
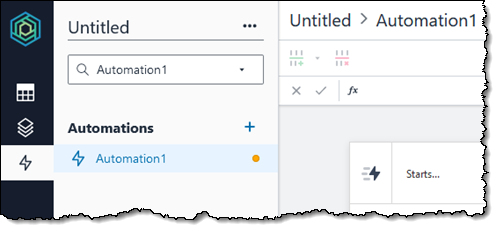
I’ll return to the apps and the App Builder in a minute, but first I’ll take a look at the automations:

Again, all of the tables and apps in the workbook can use any of the automations in the workbook.

The Honeycode App Builder
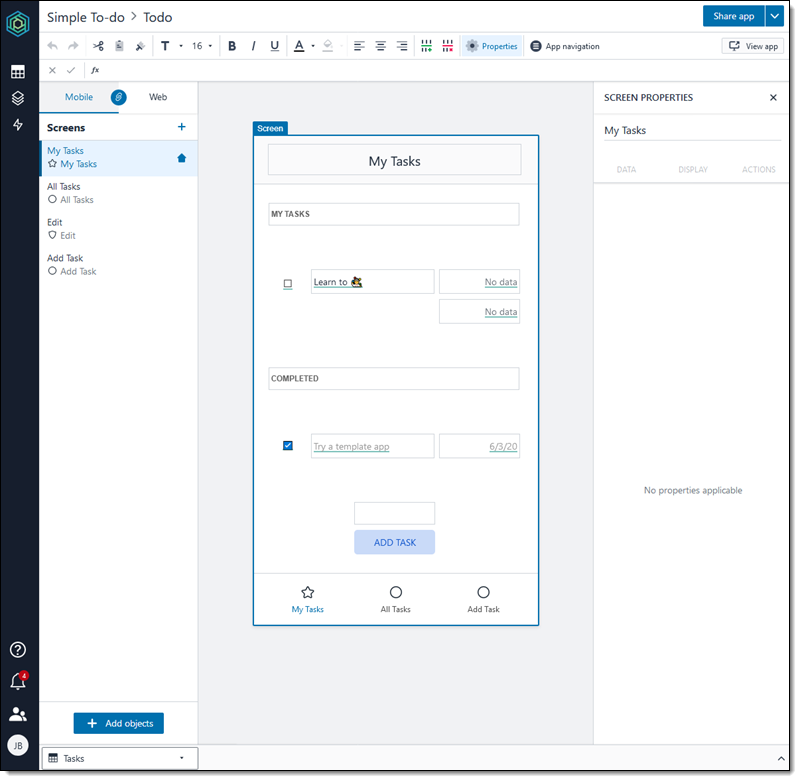
Let’s take a closer look at the app builder. As was the case with the tables, I will show you some highlights and let you explore the rest yourself. Here’s what I see when I open my Simple To-do app in the builder:

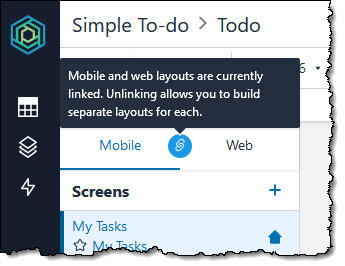
This app contains four screens (My Tasks, All Tasks, Edit, and Add Task). All screens have both web and mobile layouts. Newly created screens, and also those in this app, have the layouts linked, so that changes to one are reflected in the other. I can unlink the layouts if I want to exercise more control over the controls, the presentation, or to otherwise differentiate the two:

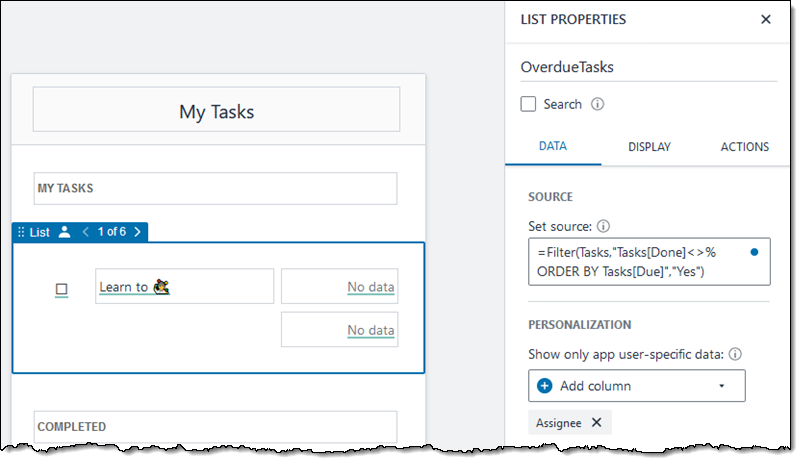
Objects within a screen can reference data in tables. For example, the List object on the My Task screen filters rows of the Tasks table, selecting the undone tasks and ordering them by the due date:

Here’s the source expression:

=Filter(Tasks,"Tasks[Done]<>% ORDER BY Tasks[Due]","Yes")

The “%”  in the filter condition is replaced by the second parameter (“Yes”) when the filter is evaluated. This substitution system makes it easy for you to create interesting & powerful filters using the FILTER() function.

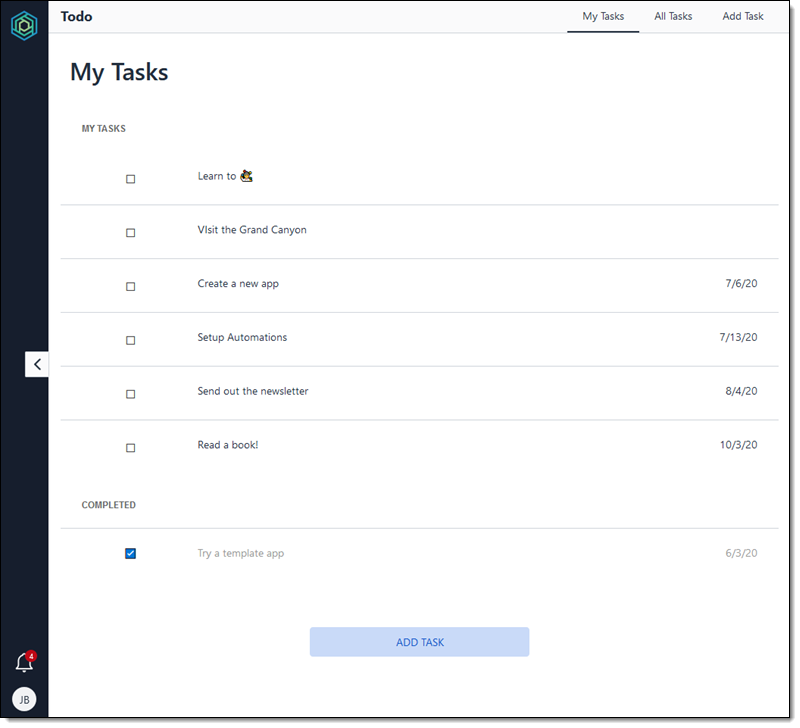
When the app runs, the objects within the List are replicated, one per task:

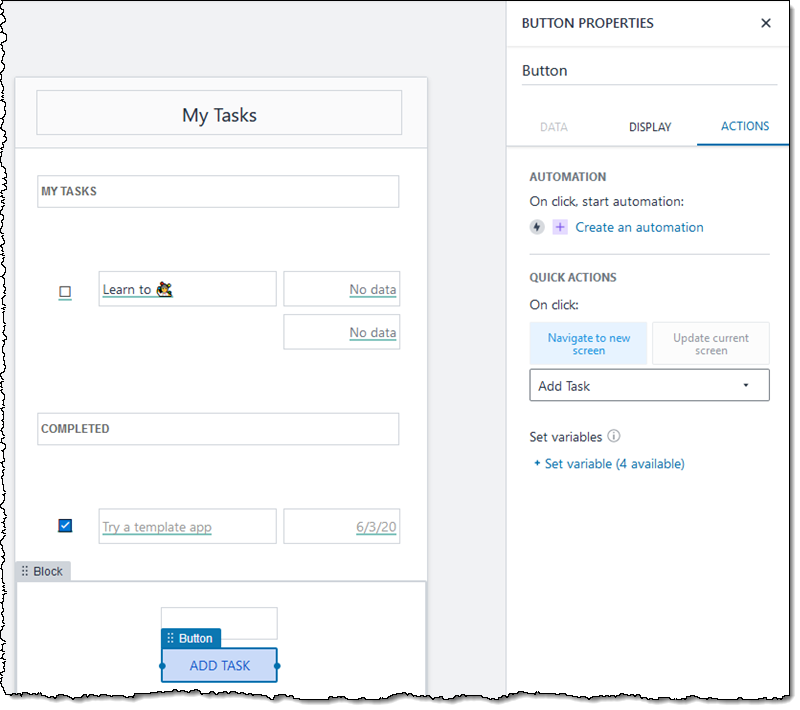
Objects on screens can initiate run automations and initiate actions. For example, the ADD TASK button navigates to the Add Task screen:
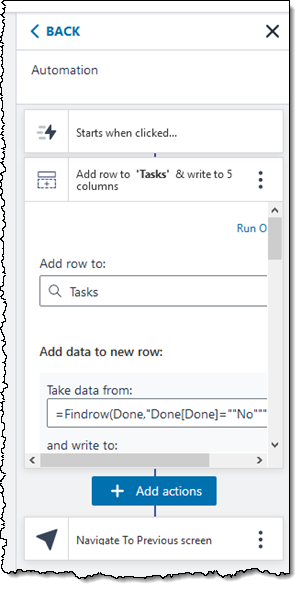
The Add Task screen prompts for the values that specify the new task, and the ADD button uses an automation that writes the values to the Tasks table:

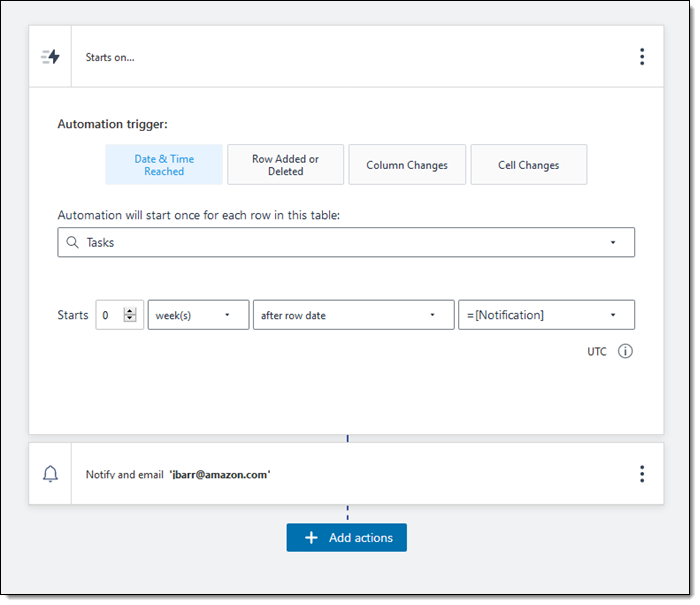
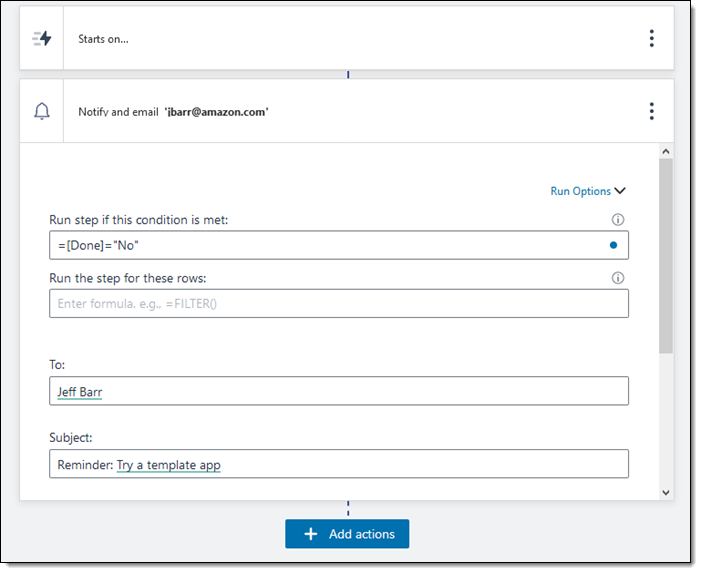
Automations can be triggered in four different ways. Here’s the automation that generates reminders for tasks that have not been marked as done. The automation runs once for each row in the Tasks table:

The notification runs only if the task has not been marked as done, and could also use the FILTER() function:

While I don’t have the space to show you how to build an app from scratch, here’s a quick overview.

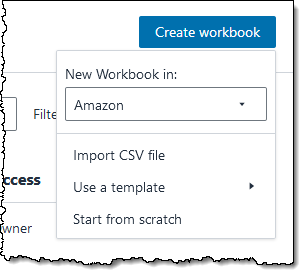
Click Create workbook and Import CSV file or Start from scratch:

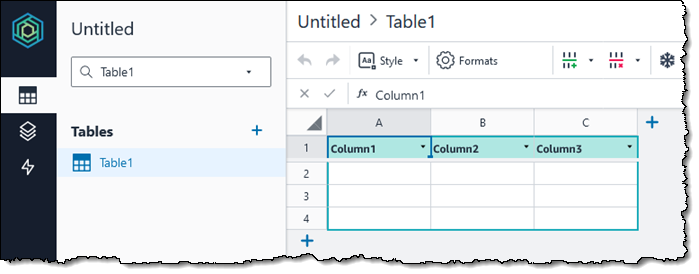
Click the Tables icon and create reference and data tables:

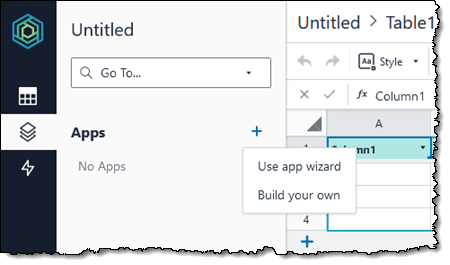
Click the Apps icon and build the app. You can select a wizard that uses your tables as a starting point, or you can start from an empty canvas.

Click the Automations icon and add time-driven or data-driven automations:

Share the app, as detailed in the next section.

Sharing Apps
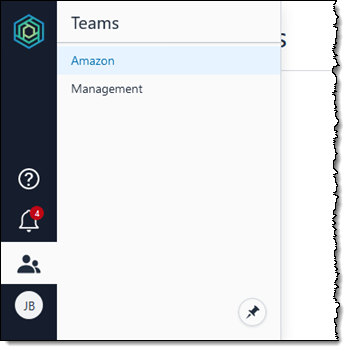
After my app is ready to go, I can share it with other members of my team. Each Honeycode user can be a member of one or more teams:

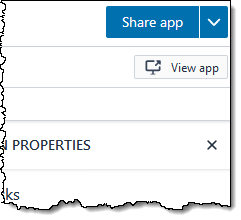
To share my app, I click Share app:

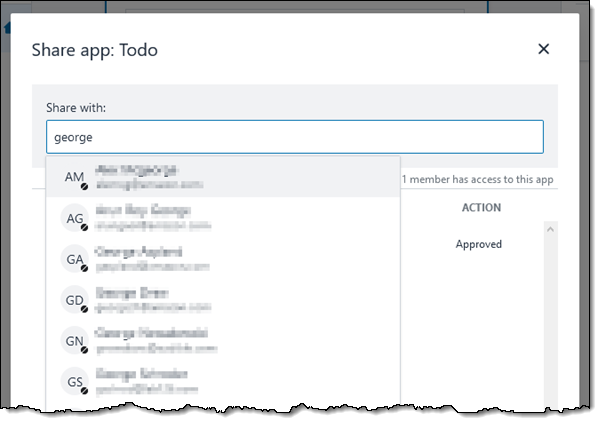
Then I search for the desired team members and share the app:

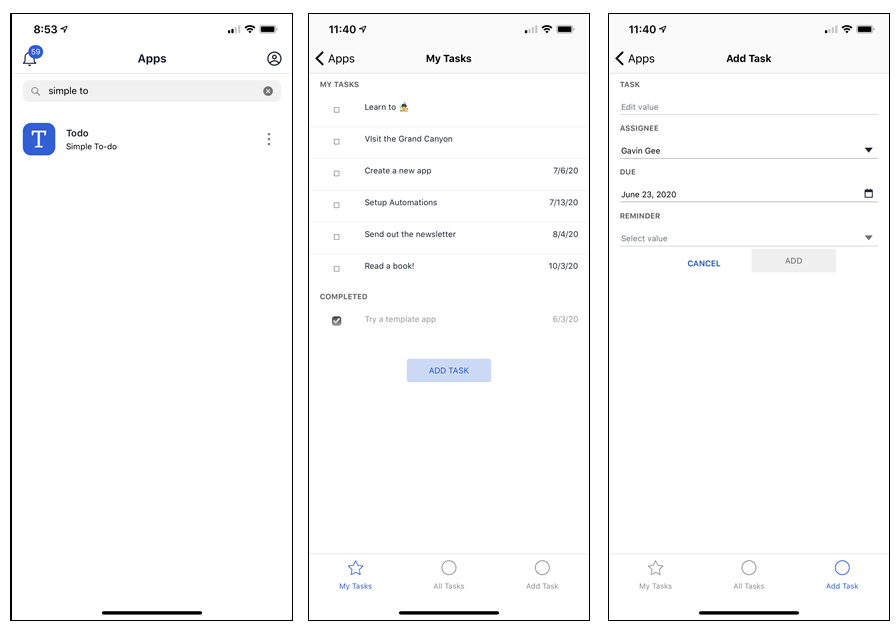
They will receive an email that contains a link, and can start using the app immediately. Users with mobile devices can install the Honeycode Player (iOS, Android) and make use of any apps that have been shared with them. Here’s the Simple To-do app:

Amazon Honeycode APIs
External applications can also use the Honeycode APIs to interact with the applications you build with Honeycode. The functions include:

GetScreenData – Retrieve data from any screen of a Honeycode application.

InvokeScreenAutomation – Invoke an automation or action defined in the screen of a Honeycode application.

Check it Out
As you can see, Amazon Honeycode is easy to use, with plenty of power to let you build apps that help you and your team to be more productive. Check it out, build something cool, and let me know what you think! You can find out more in the announcement video from Larry Augustin here:

Jeff;

PS – The Amazon Honeycode Forum is the place for you to ask questions, learn from other users, and to find tutorials and other resources that will help you to get started.

Via AWS News Blog https://ift.tt/1EusYcK