Tuesday, December 15, 2020

New –  FreeRTOS Long Term Support to Provide Years of Feature Stability

Today, I’m particularly happy to announce FreeRTOS Long Term Support (LTS). FreeRTOS is an open source, real-time operating system for microcontrollers that makes small, low-power edge devices easy to program, deploy, secure, connect, and manage. LTS releases offer a more stable foundation than standard releases as manufacturers deploy and later update devices in the field. As we have planned, LTS is now included in the FreeRTOS kernel and a set of FreeRTOS libraries needed for embedded and IoT applications, and for securely connecting microcontroller-based (MCU) devices to the cloud.

Embedded developers at original equipment manufacturers (OEMs) and MCU vendors using FreeRTOS to build long-lived applications on IoT devices now get the predictability and feature stability of an LTS release without compromising access to critical security updates. The FreeRTOS 202012.00 LTS release applies to the FreeRTOS kernel, connectivity libraries (FreeRTOS+TCP, coreMQTT, coreHTTP), security library (PKCS #11 implementation), and AWS library (AWS IoT Device Shadow).

We will provide security updates and critical bug fixes for all these libraries until December 31, 2022.

Benefits of FreeRTOS LTS
Embedded developers at OEMs who want to use FreeRTOS libraries for their long-lived applications want to benefit from security updates and bug fixes in the latest FreeRTOS mainline releases. Mainline releases can introduce both new features and critical fixes, which may increase time and effort for users to include only fixes.

An LTS release provides years of feature stability of included libraries. With an LTS release, any update will not change public APIs, file structure, or build processes that could require changes to your application. Security updates and critical bug fixes will be backported at least until Dec 31, 2022. LTS releases contain updates that only address critical issues including security vulnerabilities. Therefore, the integration of LTS releases is less disruptive to customers’ development and integration efforts as they approach and move into production. For MCU vendors, this means reduced effort in integrating a stable code base and faster time to market with vendors’ latest libraries.

Available Now
The FreeRTOS 202012.00 LTS release is available now to download. To learn more, visit FreeRTOS LTS and the documentation. Please send us feedback on the Github repository and the forum of FreeRTOS.

Channy

Via AWS News Blog https://ift.tt/1EusYcK

Announcing AWS IoT Greengrass 2.0 – With an Open Source Edge Runtime and New Developer Capabilities

I am happy to announce AWS IoT Greengrass 2.0, a new version of AWS IoT Greengrass that makes it easy for device builders to build, deploy, and manage intelligent device software. AWS IoT Greengrass 2.0 provides an open source edge runtime, a rich set of pre-built software components, tools for local software development, and new features for managing software on large fleets of devices.
AWS IoT Greengrass 2.0 edge runtime is now open source under an Apache 2.0 license, and available on Github. Access to the source code allows you to more easily integrate your applications, troubleshoot problems, and build more reliable and performant applications that use AWS IoT Greengrass.

You can add or remove pre-built software components based on your IoT use case and your device’s CPU and memory resources. For example, you can choose to include pre-built AWS IoT Greengrass components such as stream manager only when you need to process data streams with your application, or machine learning components only when you want to perform machine learning inference locally on your devices.

The AWS IoT Greengrass IoT Greengrass 2.0 includes a new command-line interface (CLI) that allows you to locally develop and debug applications on your device. In addition, there is a new local debug console that helps you visually debug applications on your device. With these new capabilities, you can rapidly develop and debug code on a test device before using the cloud to deploy to your production devices.

AWS IoT Greengrass 2.0 is also integrated with AWS IoT thing groups, enabling you to easily organize your devices in groups and manage application deployments across your devices with features to control rollout rates, timeouts, and rollbacks.

AWS IoT Greengrass 2.0 – Getting Started
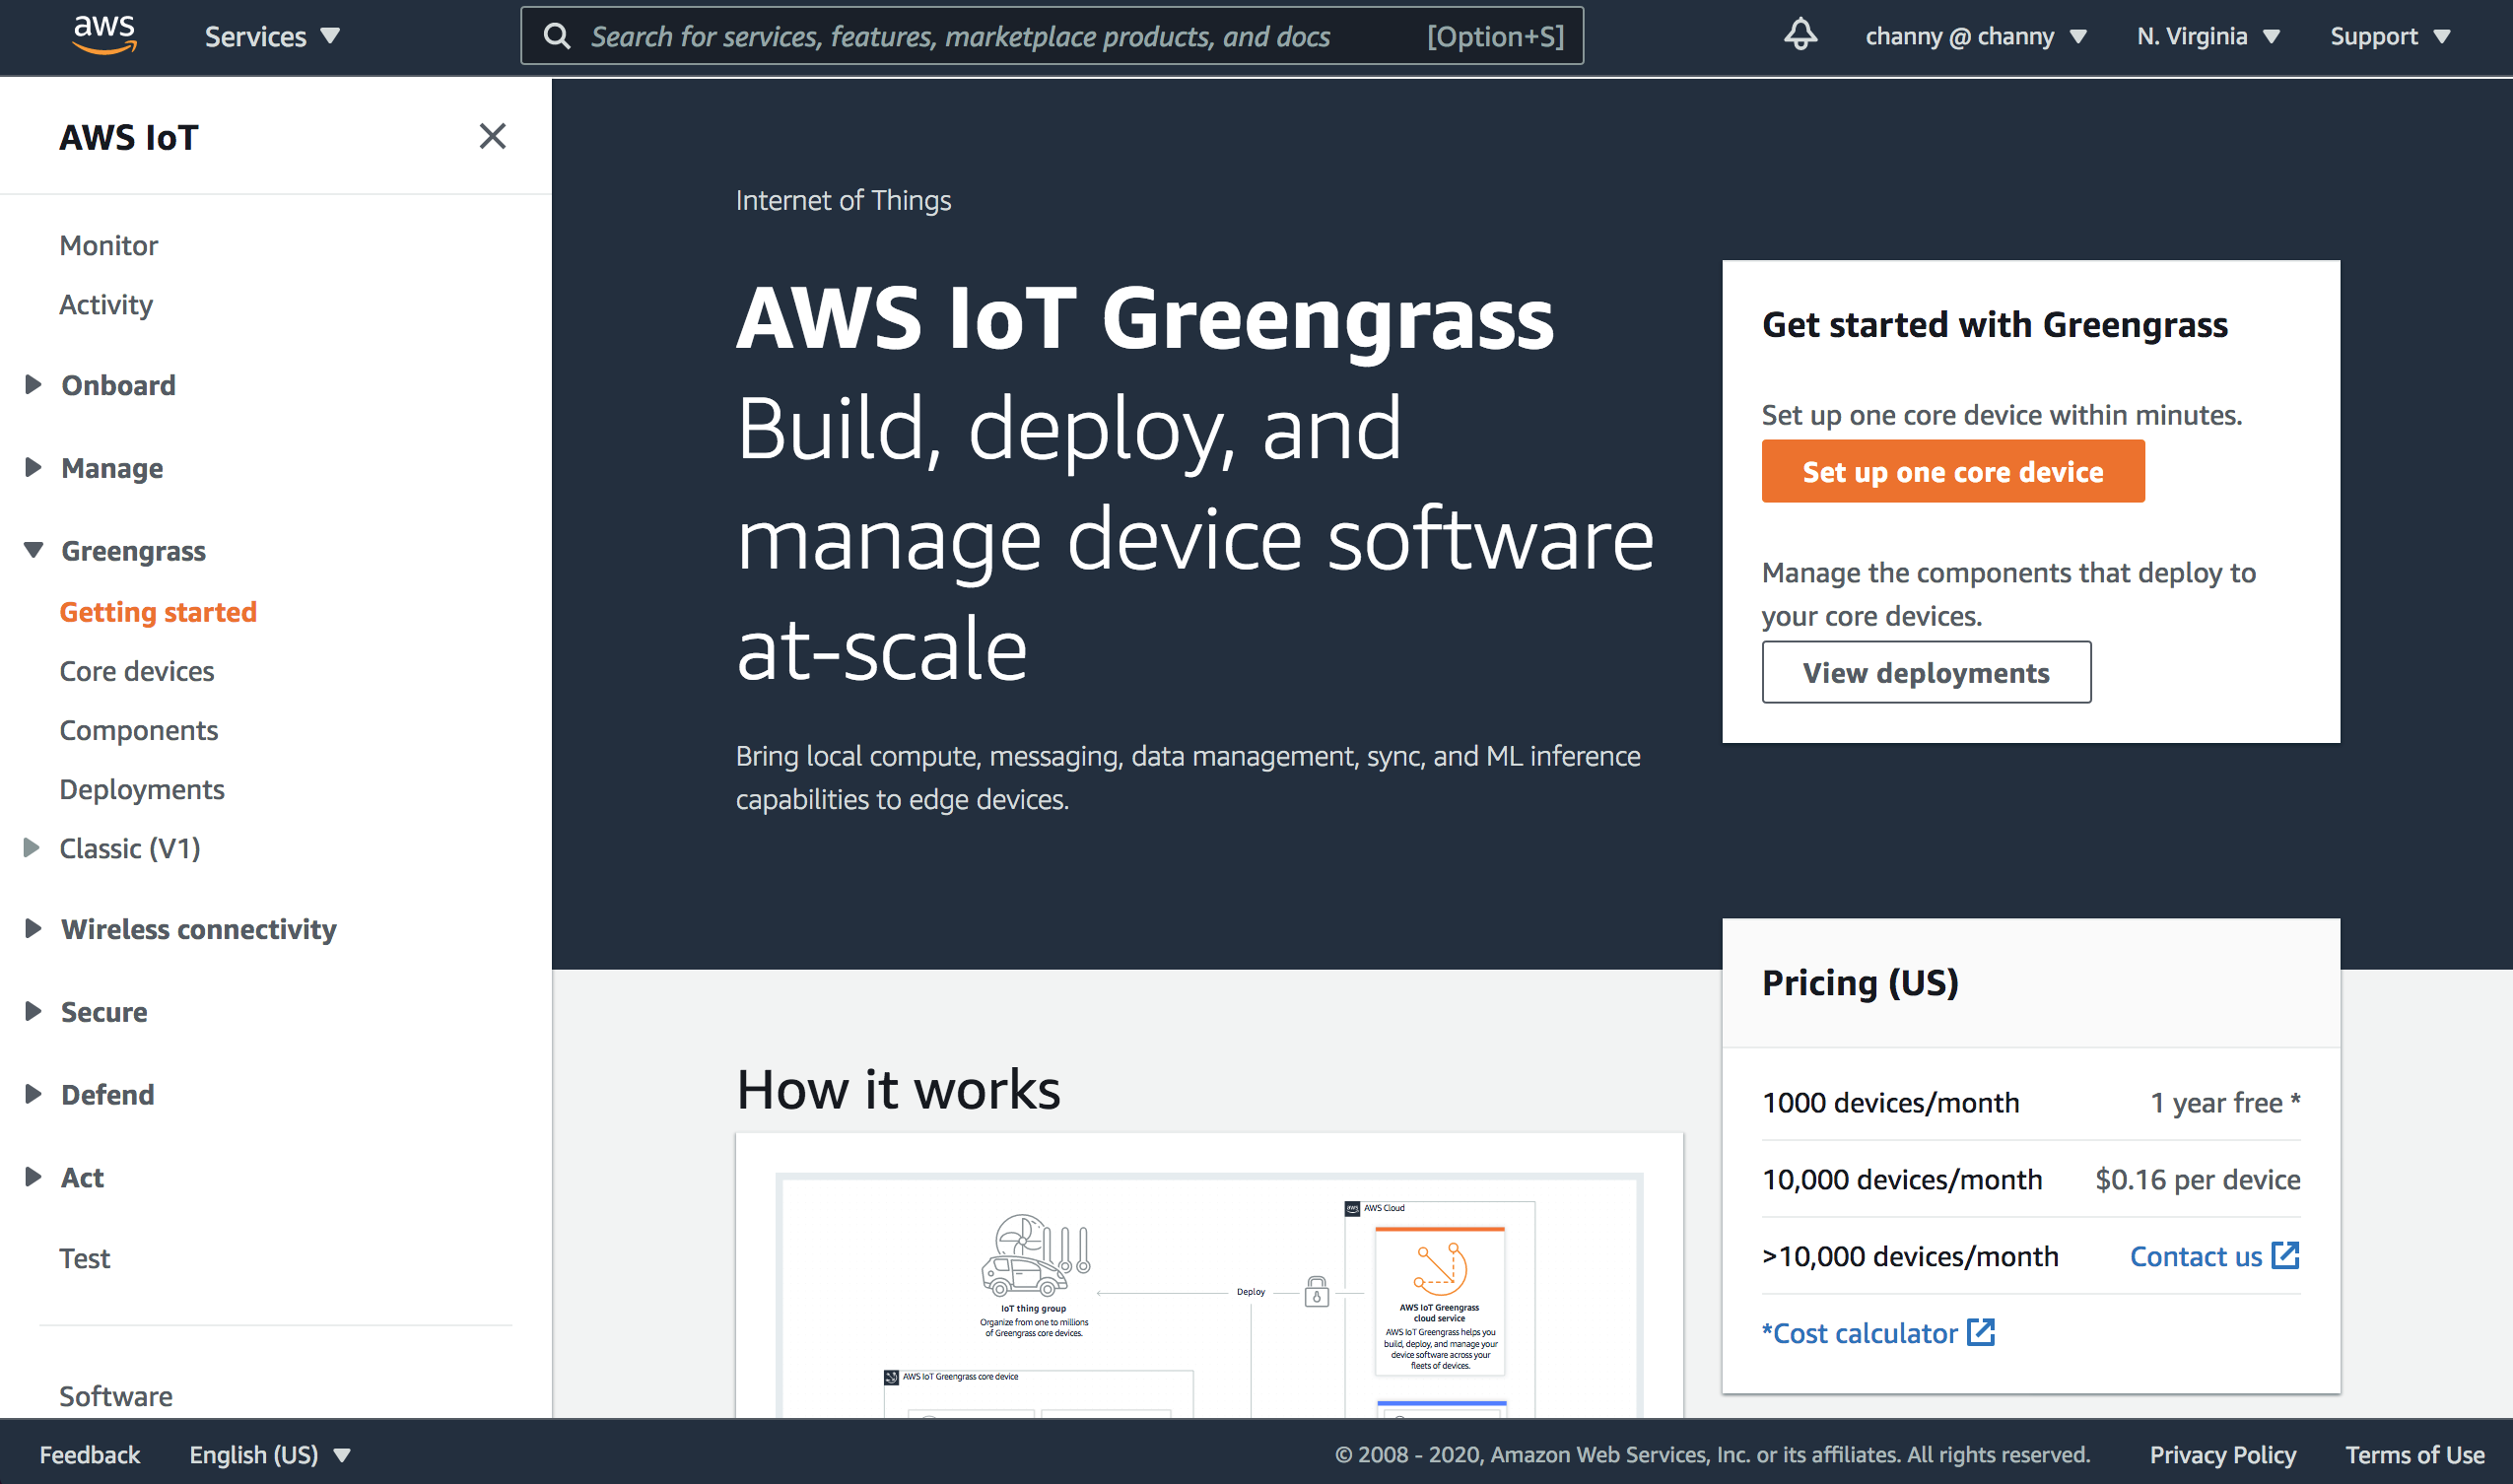
Device builders can use AWS IoT Greengrass 2.0 by going to the AWS IoT Greengrass console where you can find a download and install command that you run on your device. Once the installer is downloaded to the device, you can use it to install Greengrass software with all essential features, register the device as an AWS IoT Thing, and create a simple “hello world” software component in less than 10 minutes.

To get started in the AWS IoT Greengrass console, you first register a test device by clicking Set up core device. You assign the name and group of your core device. To deploy to only the core device, select No group. In the next step, install the AWS IoT Greengrass Core software in your device.

When the installer completes, you can find your device in the list of AWS IoT Greengrass Core devices on the Core devices page.

AWS IoT Greengrass components enable you to develop and deploy software to your AWS IoT Greengrass Core devices. You can write your application functionality and bundle it as a private component for deployment. AWS IoT Greengrass also provides public components, which provide pre-built software for common use cases that you can deploy to your devices as you develop your device software. When you finish developing the software for your component, you can register it with AWS IoT Greengrass. Then, you can deploy and run the component on your AWS IoT Greengrass Core devices.
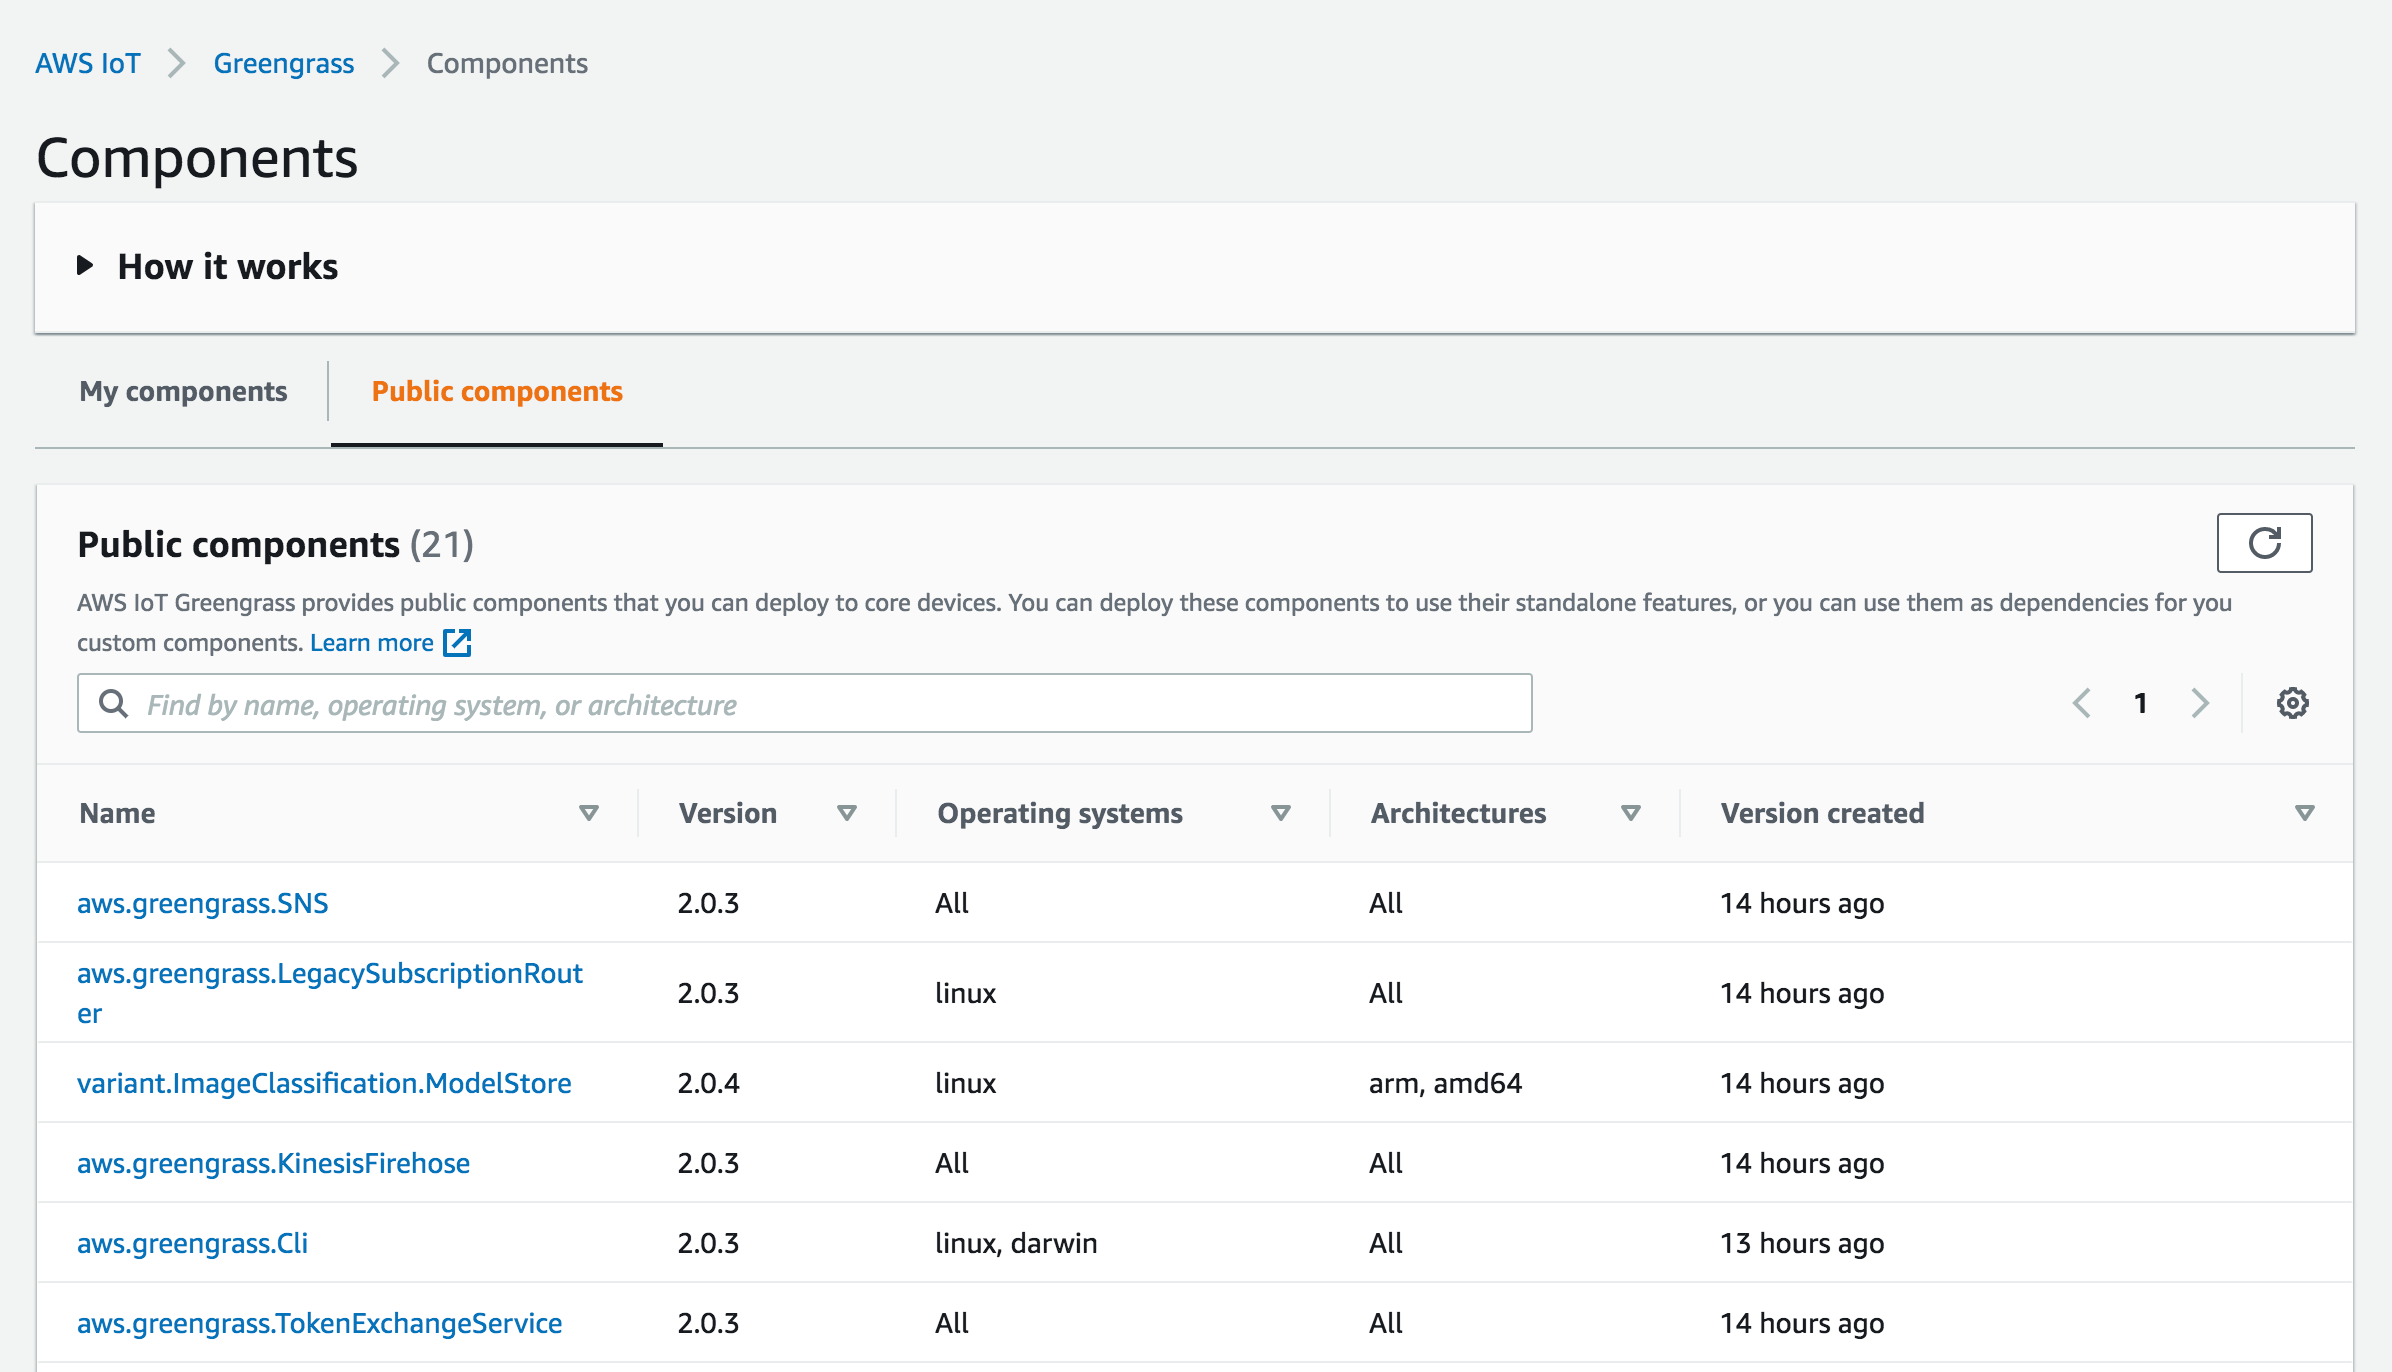
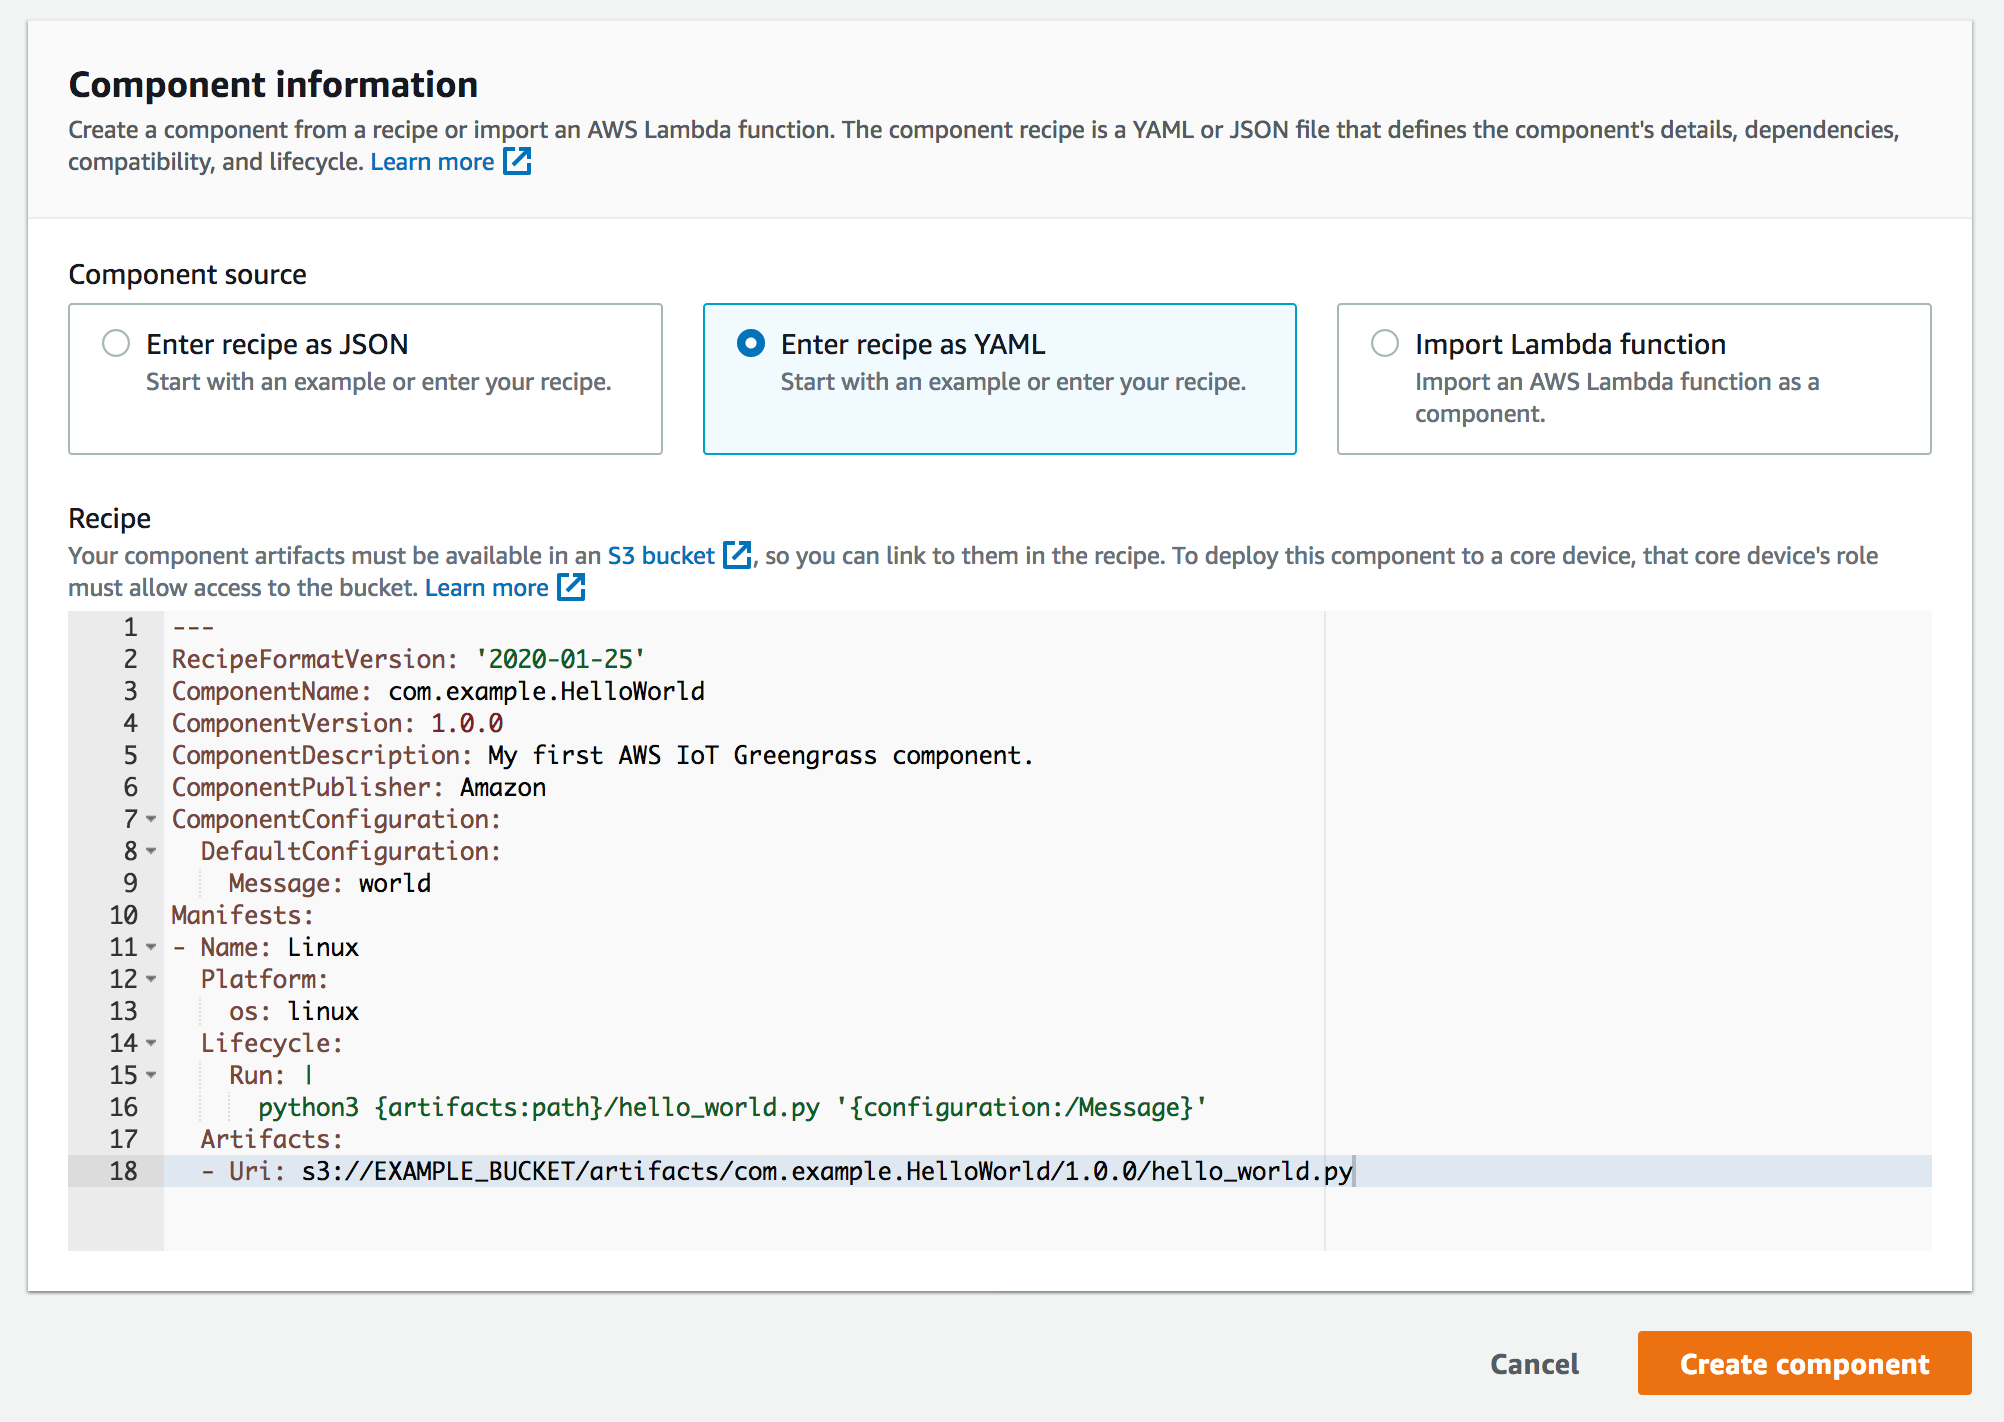
To create a component, click the Create component button on the Components page. You can use a recipe or import an AWS Lambda function. The component recipe is a YAML or JSON file that defines the component’s details, dependencies, compatibility, and lifecycle. To learn about the specifications, visit the recipe reference guide.

Here is an example of a YAML recipe.
When you finish developing your component, you can add it to a deployment configuration to deploy to one or more core devices. To create a new deployment or configure the components to deploy to core devices, click the Create button on the Deployments page. You can deploy to a core device or a thing group as a target, and select the components to deploy. The deployment includes the dependencies for each component that you select.
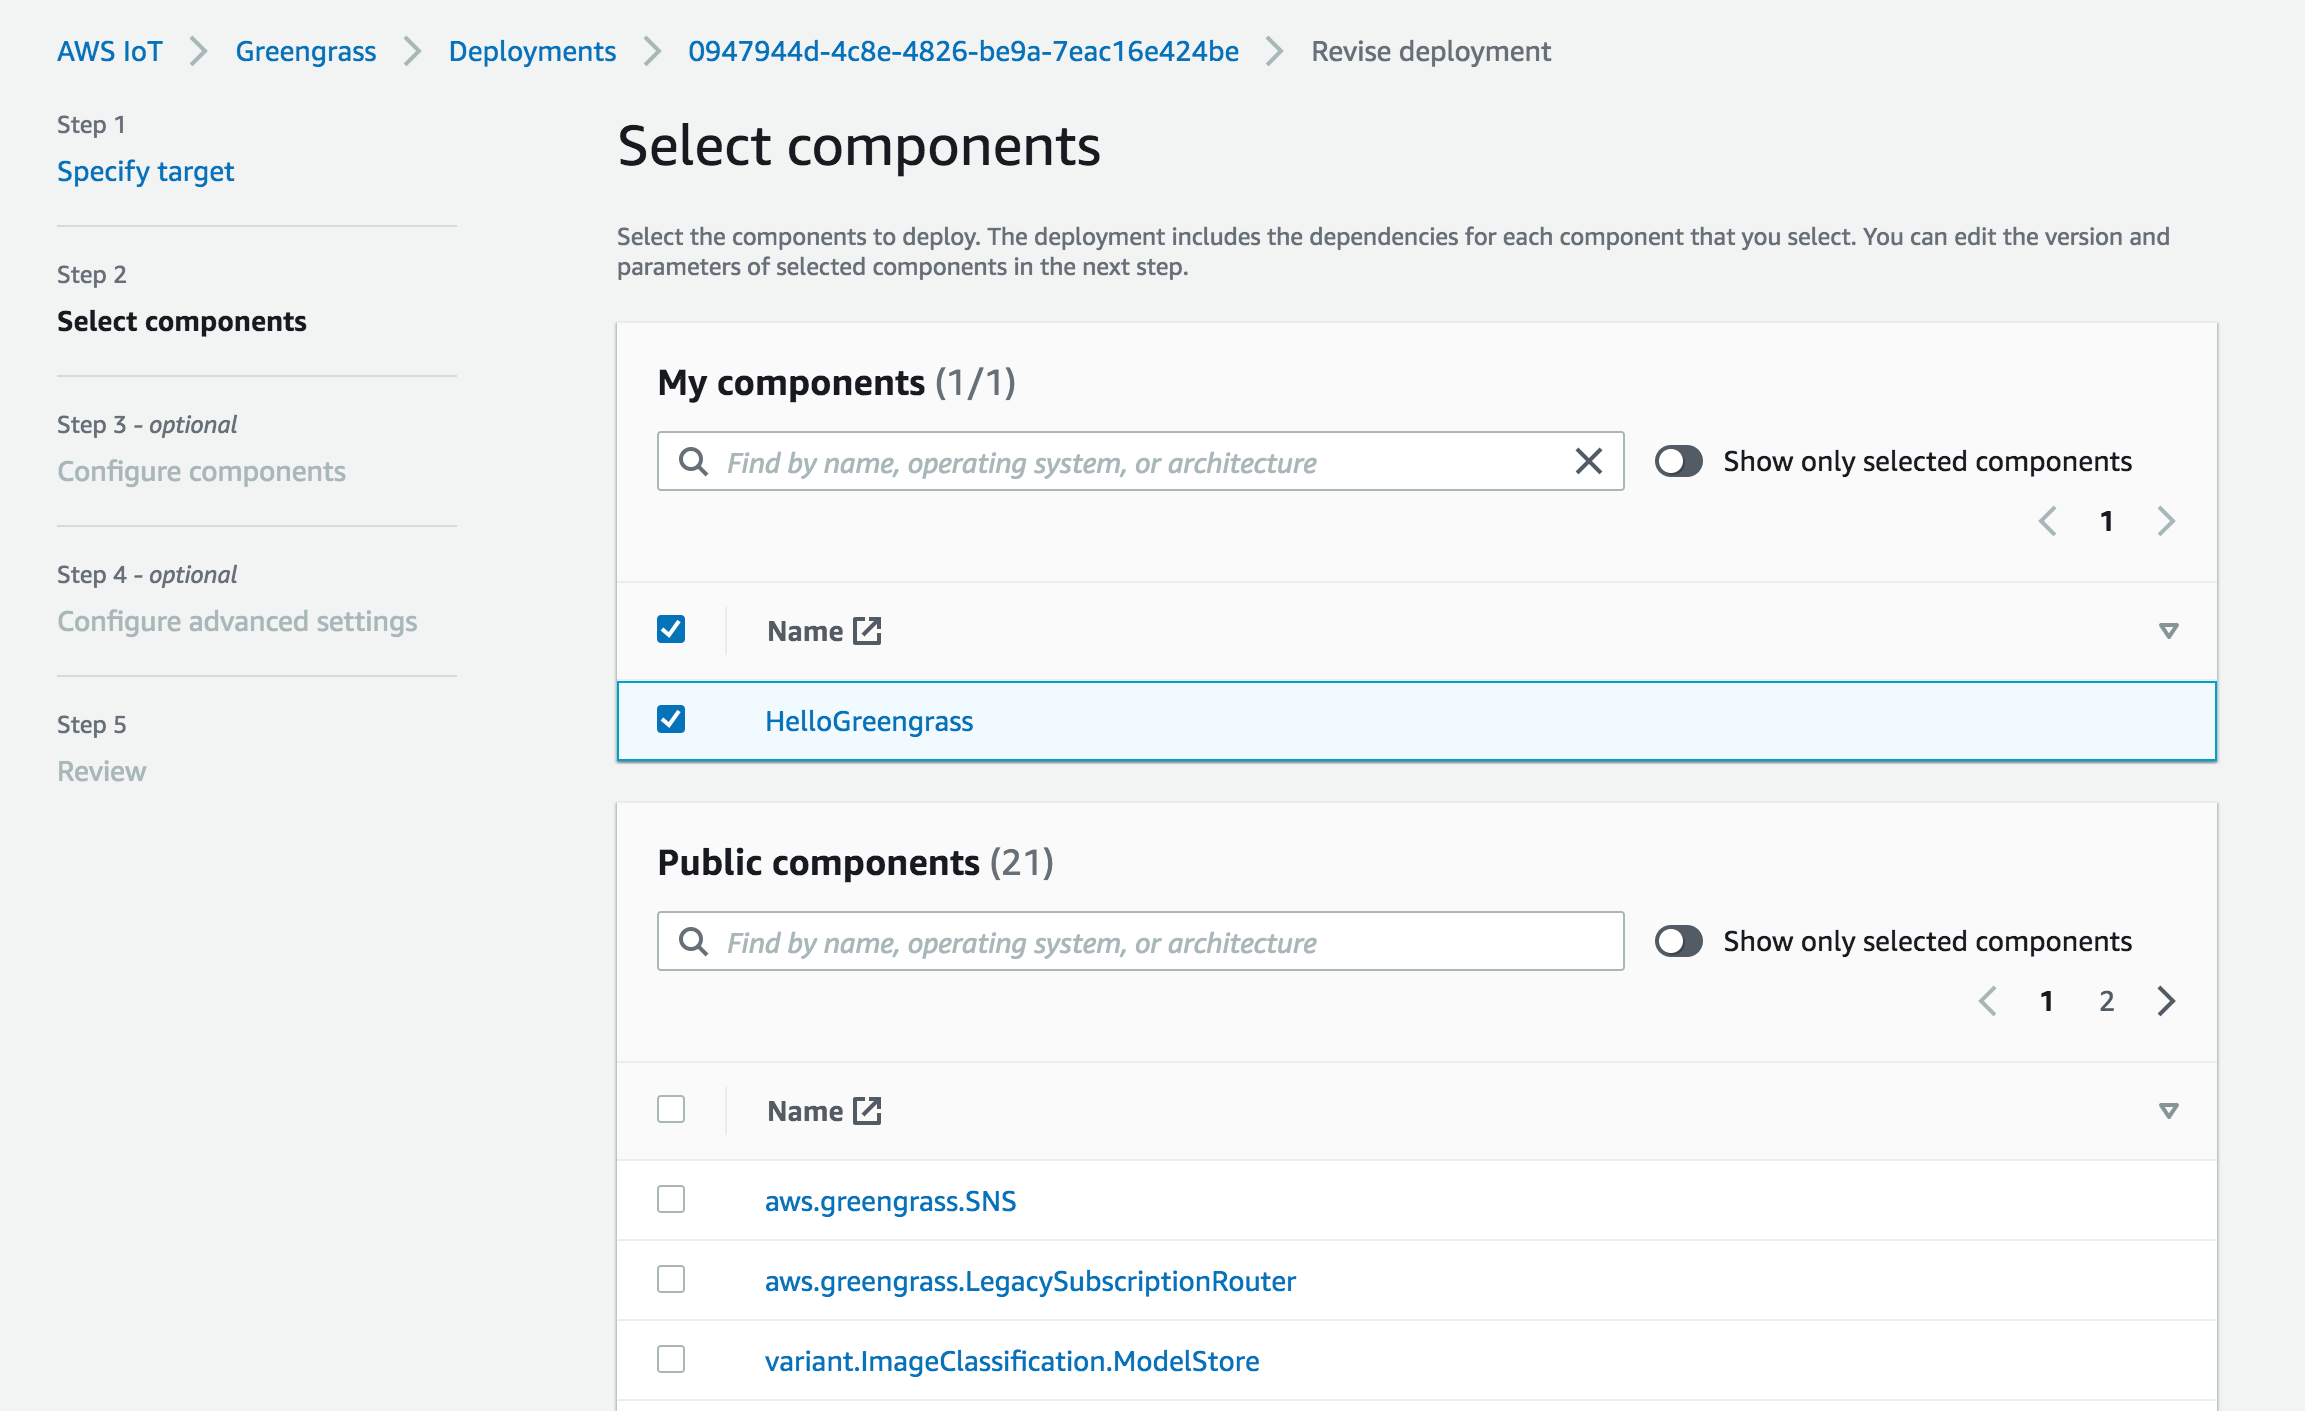
You can edit the version and parameters of selected components and advanced settings such as the rollout configuration, which defines the rate at which the configuration deploys to the target devices; timeout configuration, which defines the duration that each device has to apply the deployment; or cancel configuration, which defines when to automatically stop the deployment.

Moving to AWS IoT Greengrass 2.0
Existing devices running AWS IoT Greengrass 1.x will continue to run without any changes. If you want to take advantage of new AWS IoT Greengrass 2.0 features, you will need to move your existing AWS IoT Greengrass 1.x devices and workloads to AWS IoT Greengrass 2.0. To learn how to do this, visit the migration guide.

After you move your 1.x applications over, you can start adding components to your applications using new version 2 features, while leaving your version 1 code as-is until you decide to update them.

AWS IoT Greengrass 2.0 Partners
At launch, industry-leading partners NVIDIA and NXP have qualified a number of their devices for AWS IoT Greengrass 2.0:

See all partner device listings in the AWS Partner Device Catalog. To learn about getting your device qualified, visit the AWS Device Qualification Program.

Available Now
AWS IoT Greengrass 2.0 is available today. Please see the AWS Region table for all the regions where AWS IoT Greengrass is available. For more information, see the developer guide.

Starting today, to help you evaluate, test, and develop with this new release of AWS IoT Greengrass, the first 1,000 devices in your account will not incur any AWS IoT Greengrass charges until December 31, 2021. For pricing information, check out the AWS IoT Greengrass pricing page.

Give it a try, and please send us feedback through your usual AWS Support contacts or the AWS forum for AWS IoT Greengrass.

Learn all the details about AWS IoT Greengrass 2.0 and get started with the new version today.

Channy

Via AWS News Blog https://ift.tt/1EusYcK
New – AWS IoT Core for LoRaWAN to Connect, Manage, and Secure LoRaWAN Devices at Scale

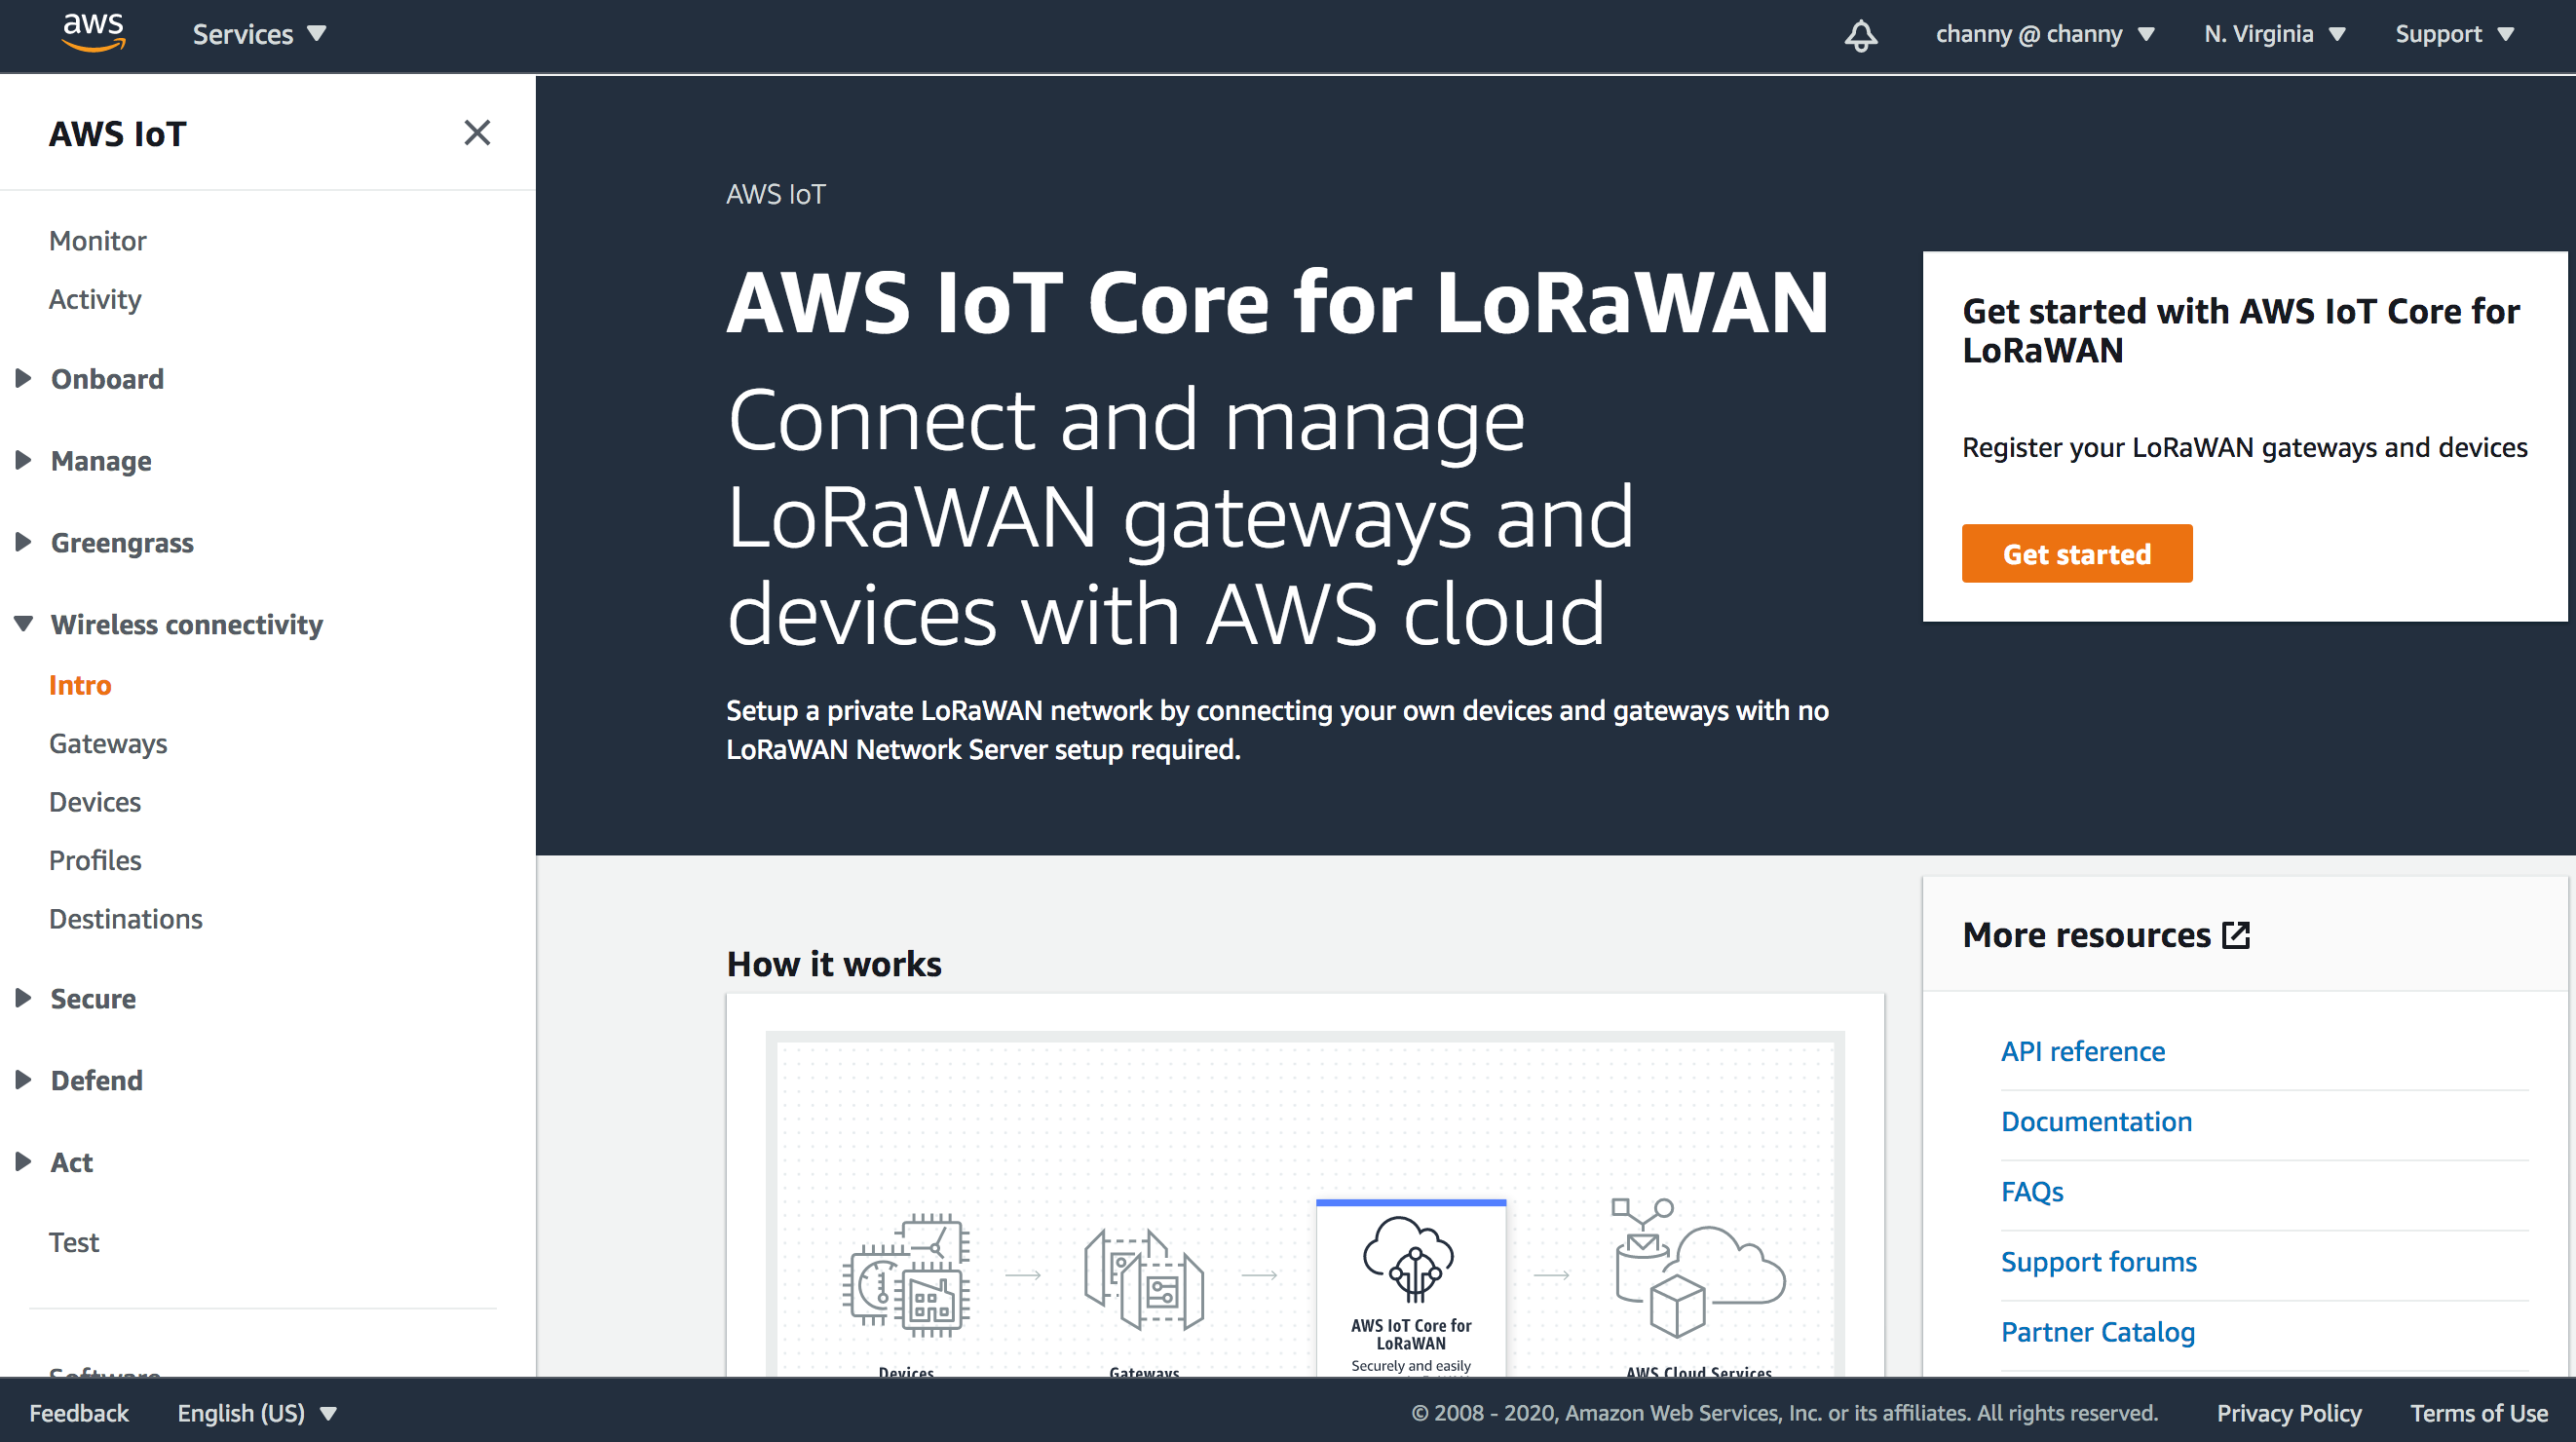
Today, I am happy to announce AWS IoT Core for LoRaWAN, a new fully-managed feature that allows AWS IoT Core customers to connect and manage wireless devices that use low-power long-range wide area network (LoRaWAN) connectivity with the AWS Cloud.

Using AWS IoT Core for LoRaWAN, customers can now set up a private LoRaWAN network by connecting their own LoRaWAN devices and gateways to the AWS Cloud – without developing or operating a LoRaWAN Network Server (LNS) by themselves. The LNS is required to manage LoRaWAN devices and gateways’ connection to the cloud; gateways serve as a bridge and carry device data to and from the LNS, usually over Wi-Fi or Ethernet.

This allows customers to eliminate the undifferentiated work and operational burden of managing an LNS, and enables them to easily and quickly connect and secure LoRaWAN device fleets at scale.

Combined with the long range and deep in-building coverage provided by LoRa technology, AWS IoT Core now enables customers to accelerate IoT application development using AWS services and acting on the data generated easily from connected LoRaWAN devices.

Customers – mostly enterprises – need to develop IoT applications using devices that transmit data over long range (1-3 miles of urban coverage or up to 10 miles for line-of-sight) or through the walls and floors of buildings, for example for real-time asset tracking at airports, remote temperature monitoring in buildings, or predictive maintenance of industrial equipment. Such applications also require devices to be optimized for low-power consumption, so that batteries can last several years without replacement, thus making the implementation cost-effective. Given the extended coverage of LoRaWAN connectivity, it is attractive to enterprises for these use cases, but setting up LoRaWAN connectivity in a privately managed site requires customers to operate an LNS.

With AWS IoT Core for LoRaWAN, you can connect LoRaWAN devices and gateways to the cloud with a few simple steps in the AWS IoT Management Console, thus speeding up the network setup time, and connect off-the-shelf LoRaWAN devices, without any requirement to modify embedded software, for a plug and play experience.

AWS IoT Core for LoRaWAN – Getting Started
Getting started with a LoRaWAN network setup is easy. You can find AWS IoT Core for LoRaWAN qualified gateways and developer kits from the AWS Partner Device Catalog. AWS qualified gateways and developer kits are pre-tested and come with a step by step guide from the manufacturer on how to connect it with AWS IoT Core for LoRaWAN.

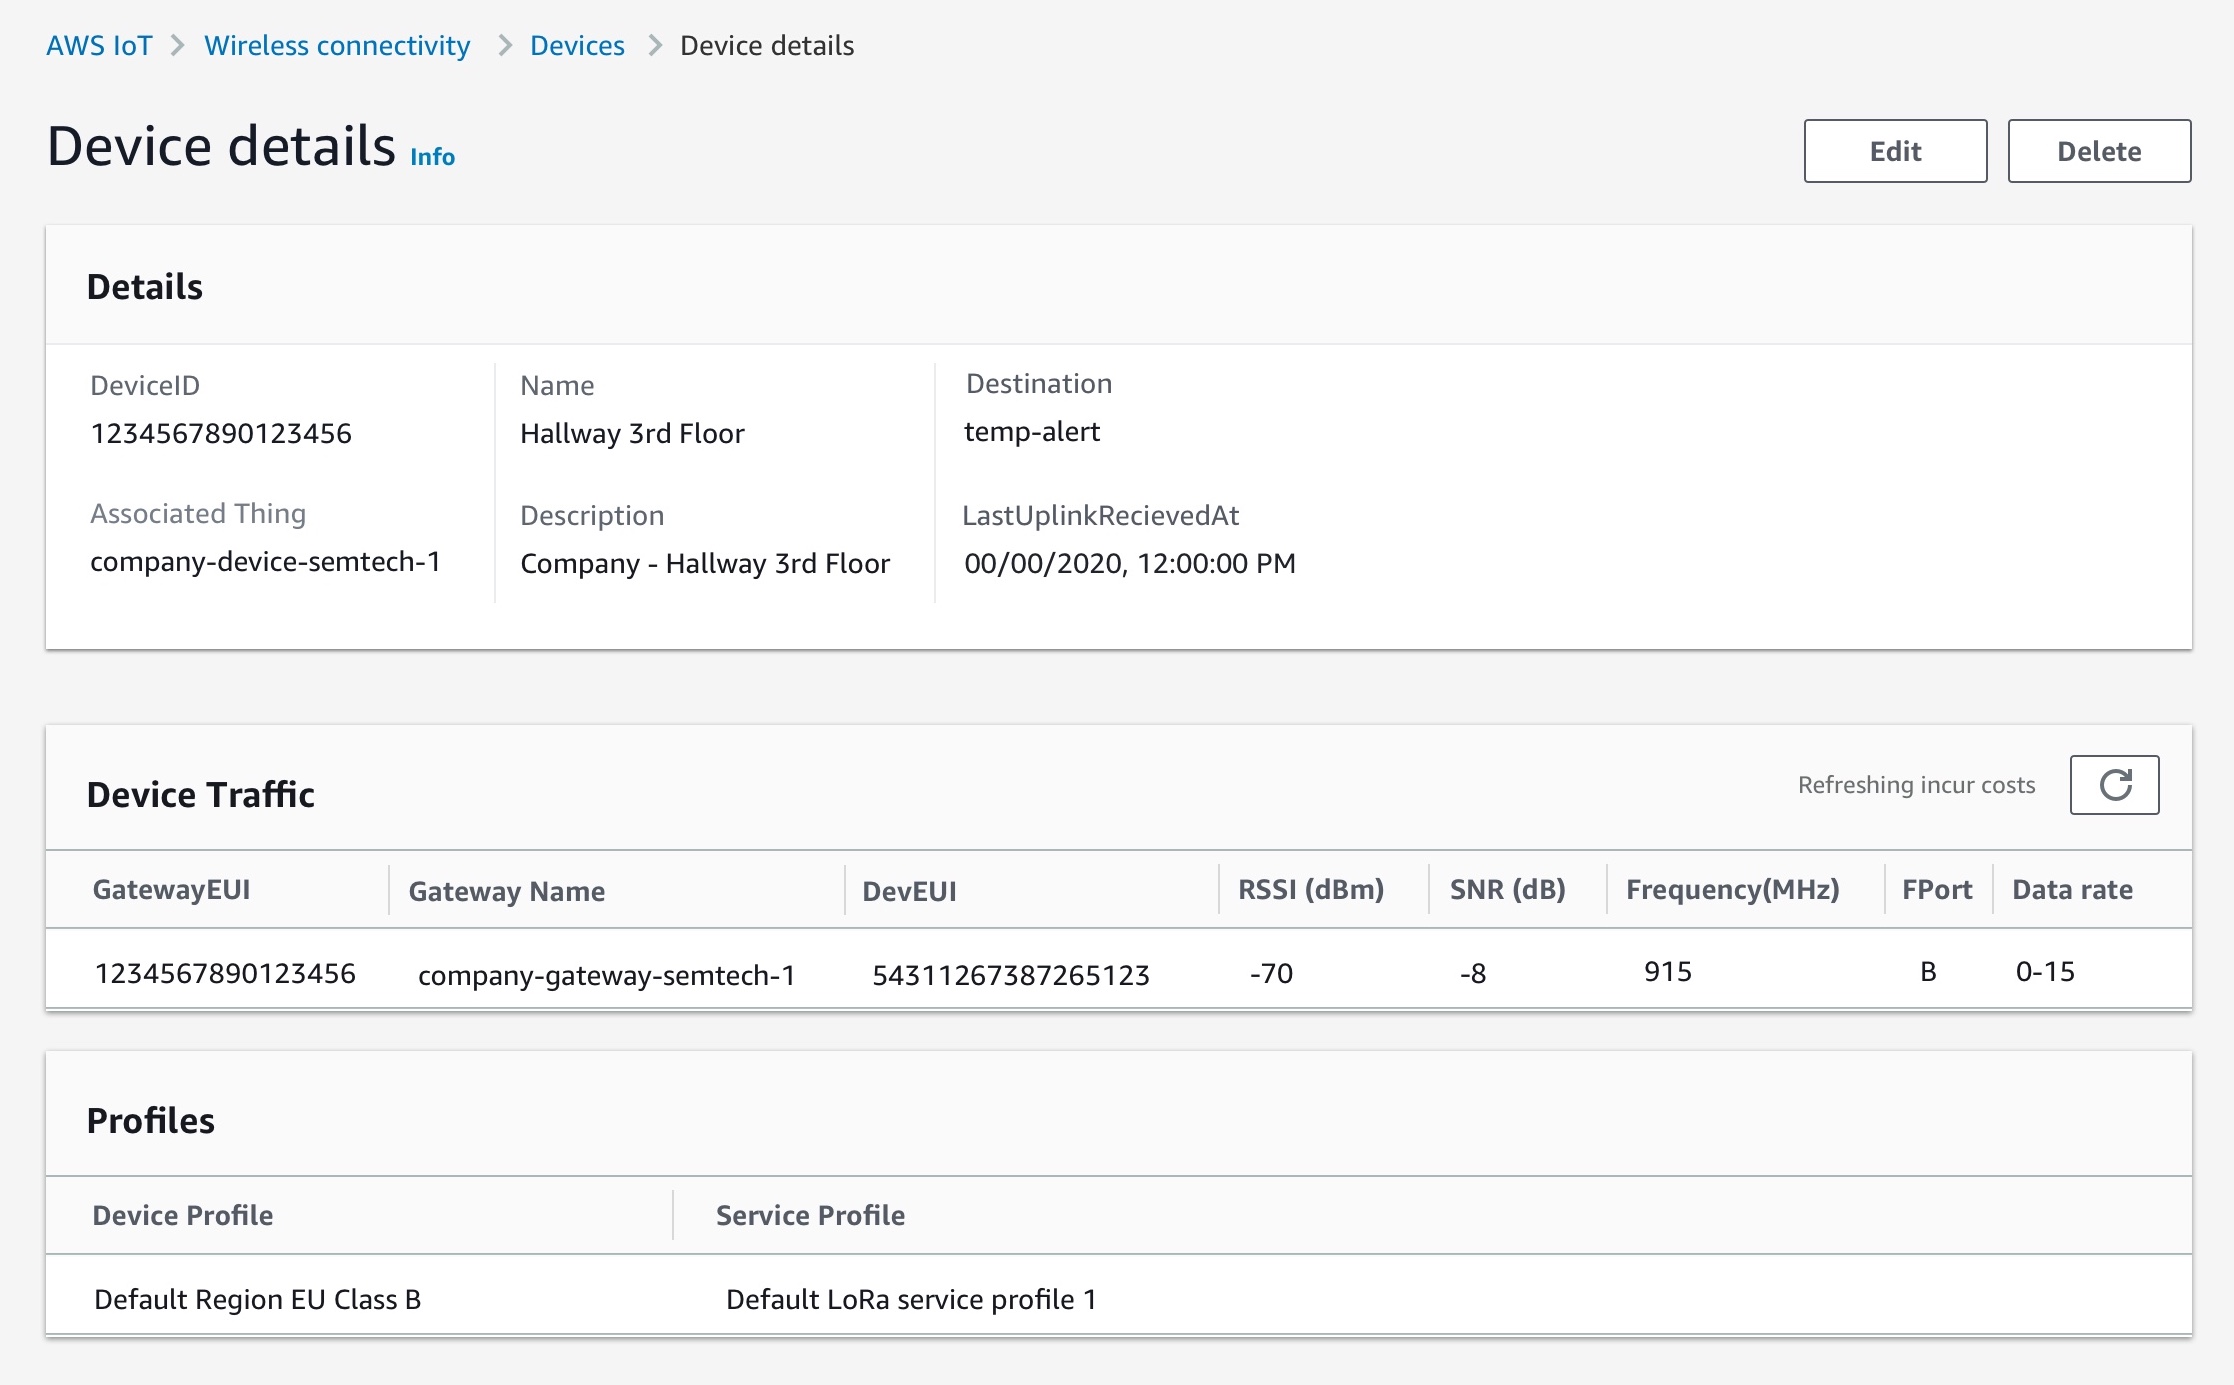
With AWS IoT Core console, you can register the gateways by providing a gateway’s unique identifier (provided by the gateway vendor) and selecting LoRa frequency band. For registering devices, you can input device credentials (identifiers and security keys provided by the device vendor) on the console.

Each device has a Device Profile that specifies the device capabilities and boot parameters the LNS requires to set up LoRaWAN radio access service. Using the console, you can select a pre-populated Device Profile or create a new one.

A destination automatically routes messages from LoRaWAN devices to AWS IoT Rules Engine. Once a destination is created, you can use it to map multiple LoRaWAN devices to the same IoT rule. You can write rules using simple SQL queries, to transform and act on the device data, like converting data from proprietary binary to JSON format, raising alerts, or routing it to other AWS services like Amazon Simple Storage Service (S3). From the console, you can also query metrics for connected devices and gateways to troubleshoot connectivity issues.

Available Now
AWS IoT Core for LoRaWAN is available today in US East (N. Virginia) and Europe (Ireland) Regions. With pay-as-you-go pricing and no monthly commitments, you can connect and scale LoRaWAN device fleets reliably, and build applications with AWS services quickly and efficiently. For more information, see the pricing page.

To get started, buy an AWS qualified LoRaWAN developer kit and and launch Getting Started experience in the AWS Management Console. To learn more, visit the developer guide. Give this a try, and please send us feedback either through your usual AWS Support contacts or the AWS forum for AWS IoT.

Learn all the details about AWS IoT Core for LoRaWAN and get started with the new feature today.

Channy

Via AWS News Blog https://ift.tt/1EusYcK

Announcing Amazon Managed Service for Grafana (in Preview)

Today, in partnership with Grafana Labs, we are excited to announce in preview, Amazon Managed Service for Grafana (AMG), a fully managed service that makes it easy to create on-demand, scalable, and secure Grafana workspaces to visualize and analyze your data from multiple sources.

Grafana is one of the most popular open source technologies used to create observability dashboards for your applications. It has a pluggable data source model and support for different kinds of time series databases and cloud monitoring vendors. Grafana centralizes your application data from multiple open-source, cloud, and third-party data sources.

Many of our customers love Grafana, but don’t want the burden of self-hosting and managing it. AMG manages the provisioning, setup, scaling, version upgrades and security patching of Grafana, eliminating the need for customers to do it themselves. AMG automatically scales to support thousands of users with high availability.

With AMG, you will get a fully managed and secure data visualization service where you can query, correlate, and visualize operational metrics, logs and traces across multiple data sources including cloud services such as AWS, Google, and Microsoft. AMG is integrated with AWS data sources, such as Amazon CloudWatch, Amazon Elasticsearch Service, AWS X-Ray, AWS IoT SiteWise, Amazon Timestream, and others to collect operational data in a simple way. Additionally, AMG also provides plug-ins to connect to popular third-party data sources, such as Datadog, Splunk, ServiceNow, and New Relic by upgrading to Grafana Enterprise directly from the AWS Console.

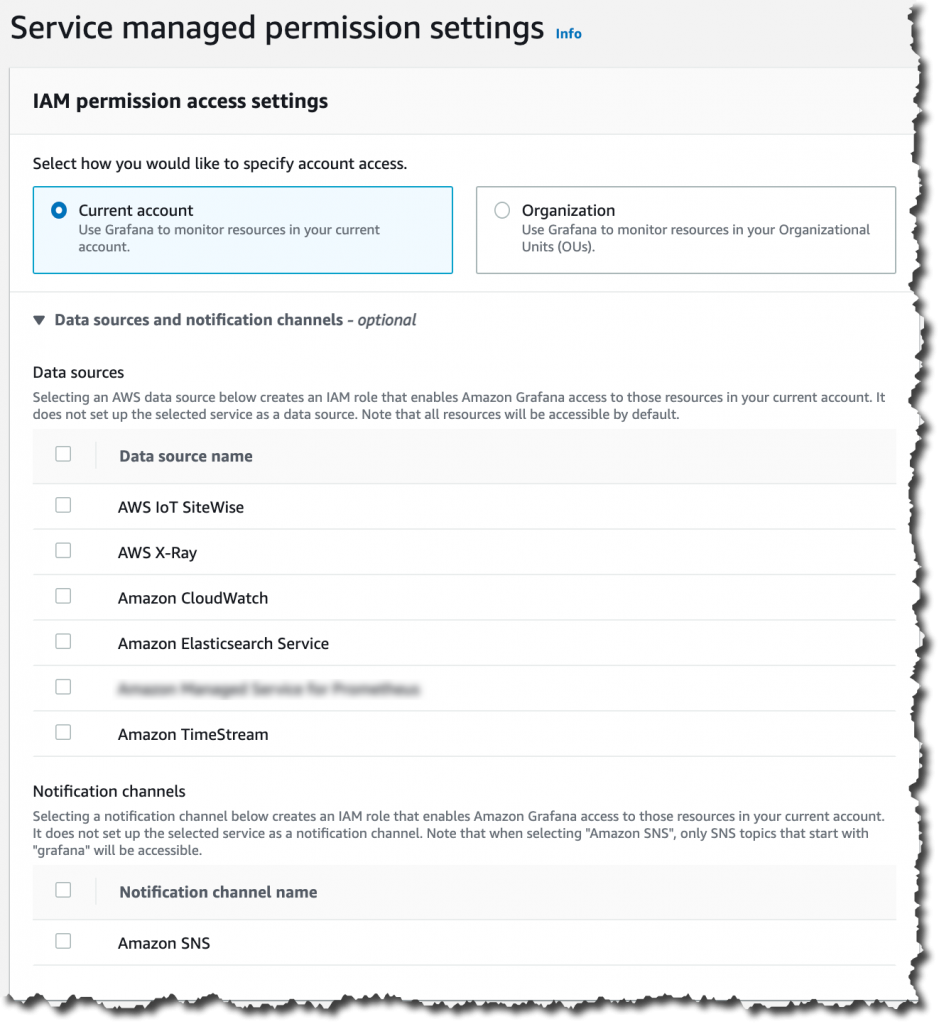
Screenshot for creating and configuring a managed Grafana workspace

AMG integrates directly into your AWS Organizations. You can define a AMG workspace in one AWS account that allows you to discover and access datasources in all your accounts and regions across your AWS organization. Creating dashboards in Grafana is easy as all these different datasources are discoverable in one place.

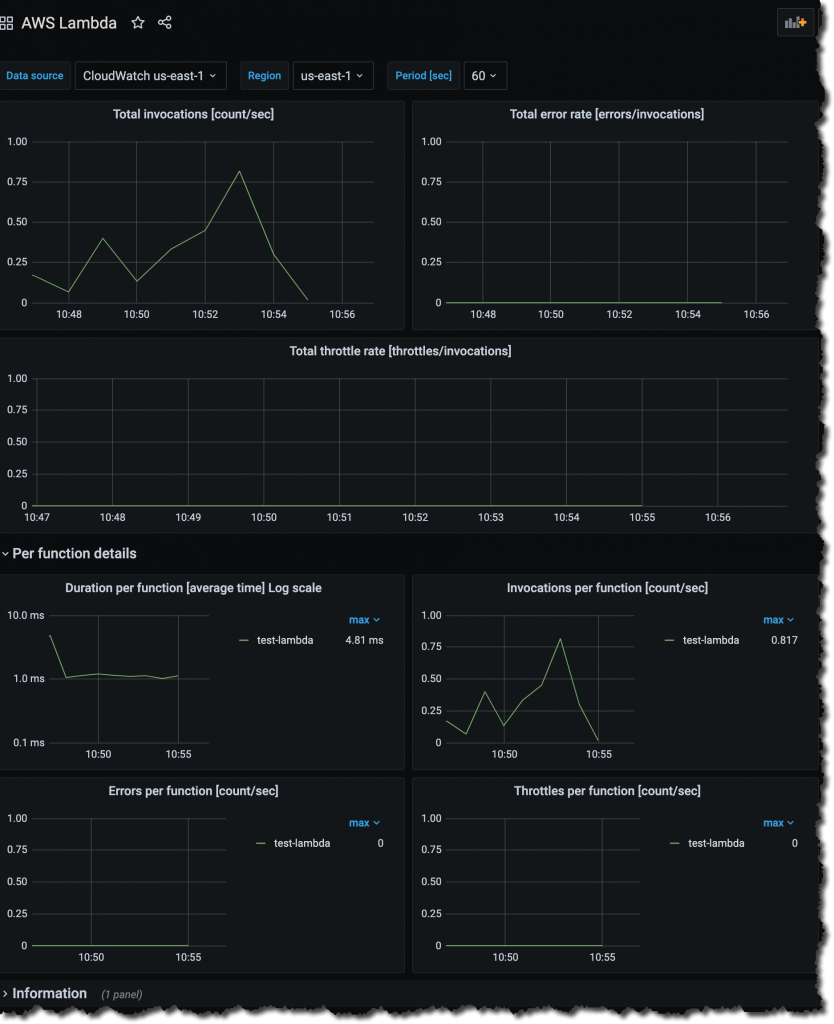
Customers really like Grafana for the ease of creating dashboards, it comes with many built-in dashboards to use when you add a new data source, or you can take advantage of its broad community of pre-built dashboards. For example, you can see in the following image a really nice dashboard that AMG created for me from one of my AWS Lambda function.

Screenshot of an automatic dashboard for Lambda function

One of my favorite things from AMG is the built-in security features. You can easily enable single sign-on using AWS Single Sign-On, restrict access to data sources and dashboards to the right users, and access audit logs via AWS CloudTrail for your hosted Grafana workspace. With AWS Single Sign-On you can leverage your existing corporate directories to enforce authentication and authorization permissions.

Another powerful feature that AMG has is support for Alerts. AMG integrates with Amazon Simple Notification Service (SNS) so customers can send Grafana alerts to SNS as a notification destination. It also has support for four other alert destinations including PagerDuty, Slack, VictorOps and OpsGenie.

There are no up-front investments required to use AMG, and you only pay a monthly active user license fee. This means that you can provision many users to access to your Grafana workspace, but will only be billed for active users that log in and use the workspace that month. Users granted access but that do not log in, will not be billed that month. You can also upgrade to Grafana Enterprise using AWS Marketplace, to get access to enterprise plugins, support, and training content directly from Grafana Labs.

Availability

This service is available in US East (N. Virginia) and Europe (Ireland) regions. To learn more visit the AMG service page, and be sure to join our re:Invent session tomorrow 12/16 from 8:00am – 8:30am PST for a demo!

AMG is now available in preview; to get access to this service fill out the registration form here.

Marcia

Via AWS News Blog https://ift.tt/1EusYcK

Join the Preview – Amazon Managed Service for Prometheus (AMP)

Observability is an essential aspect of running cloud infrastructure at scale. You need to know that your resources are healthy and performing as expected, and that your system is delivering the desired level of performance to your customers.

A lot of challenges arise when monitoring container-based applications. First, because container resources are transient and there are lots of metrics to watch, the monitoring data has strikingly high cardinality. In plain language this means that there are lots of unique values, which can make it harder to define a space-efficient storage model and to create queries that return meaningful results. Second, because a well-architected container-based system is composed using a large number of moving parts, ingesting, processing, and storing the monitoring data can become an infrastructure challenge of its own.

Prometheus is a leading open-source monitoring solution with an active developer and user community. It has a multi-dimensional data model that is a great fit for time series data collected from containers.

Introducing Amazon Managed Service for Prometheus (AMP)
Today we are launching a preview of Amazon Managed Service for Prometheus (AMP). This fully-managed service is 100% compatible with Prometheus. It supports the same metrics, the same PromQL queries, and can also make use of the 150+ Prometheus exporters. AMP runs across multiple Availability Zones for high availability, and is powered by CNCF Cortex for horizontal scalability. AMP will easily scale to ingest, store, and query millions of time series metrics.

The preview includes support for Amazon Elastic Kubernetes Service (EKS) and Amazon Elastic Container Service (ECS). It can also be used to monitor your self-managed Kubernetes clusters that are running in the cloud or on-premises.

Getting Started with Amazon Managed Service for Prometheus (AMP)
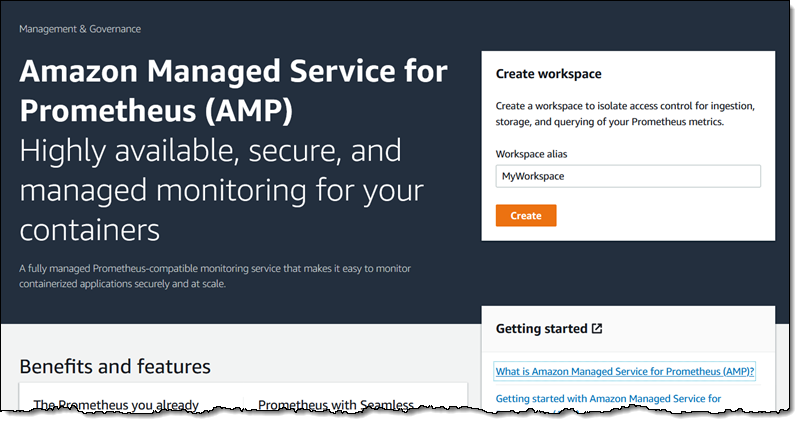
After joining the preview, I open the AMP Console, enter a name for my AMP workspace, and click Create to get started (API and CLI support is also available):

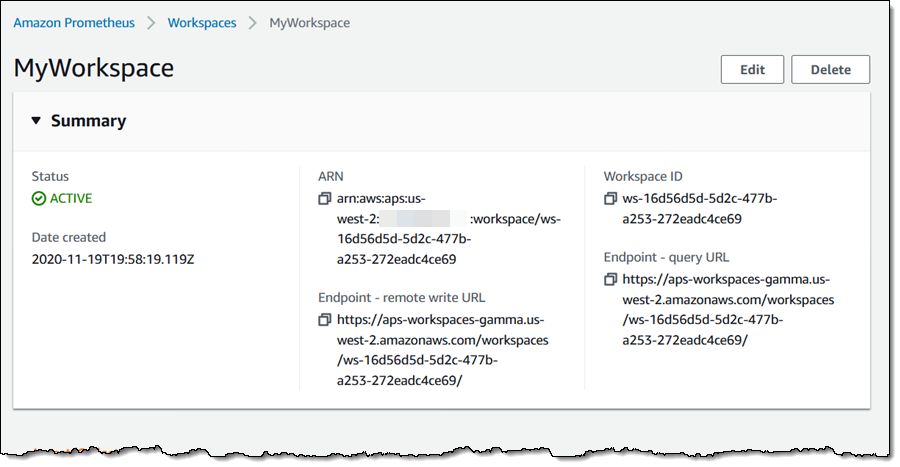
My workspace is active within a minute or so. The console provides me with the endpoints that I can use to write data to my workspace, and to issue queries:

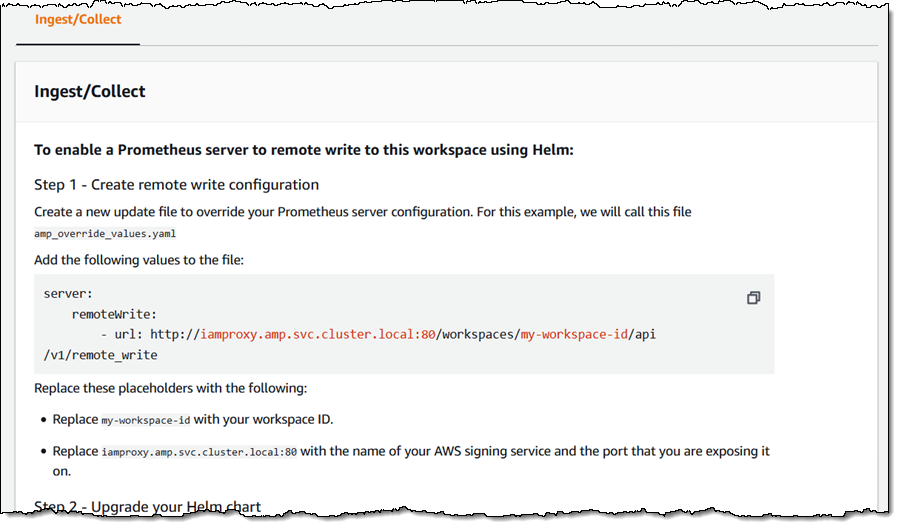
It also provides guidance on how to configure an existing Prometheus server to send metrics to the AMP workspace:

I can also use AWS Distro for OpenTelemetry to scrape Prometheus metrics and send them to my AMP workspace.

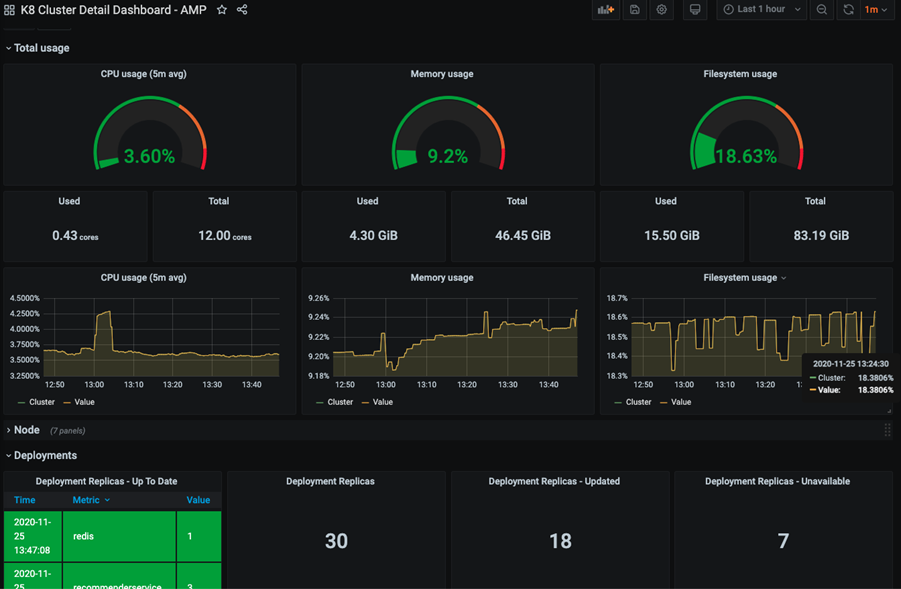
Once I have stored some metrics in my workspace, I can run PromQL queries and I can use Grafana to create dashboards and other visualizations. Here’s a sample Grafana dashboard:

Join the Preview
As noted earlier, we’re launching Amazon Managed Service for Prometheus (AMP) in preview form and you are welcome to try it out today.

We’ll have more info (and a more detailed blog post) at launch time.

Jeff;

Via AWS News Blog https://ift.tt/1EusYcK