Wednesday, November 18, 2020

Introducing Amazon S3 Storage Lens – Organization-wide Visibility Into Object Storage

When starting out in the cloud, a customer’s storage requirements might consist of a handful of S3 buckets, but as they grow, migrate more applications and realize the power of the cloud, things can become more complicated. A customer may have tens or even hundreds of accounts and have multiple S3 buckets across numerous AWS Regions. Customers managing these sorts of environments have told us that they find it difficult to understand how storage is used across their organization, optimize their costs, and improve security posture.

Drawing from more than 14 years of experience helping customers optimize their storage, the S3 team has built a new feature called Amazon S3 Storage Lens. This is the first cloud storage analytics solution to give you organization-wide visibility into object storage, with point-in-time metrics and trend lines as well as actionable recommendations. All these things combined will help you discover anomalies, identify cost efficiencies and apply data protection best practices.

With S3 Storage Lens , you can understand, analyze, and optimize storage with 29+ usage and activity metrics and interactive dashboards to aggregate data for your entire organization, specific accounts, regions, buckets, or prefixes. All of this data is accessible in the S3 Management Console or as raw data in an S3 bucket.

Every Customer Gets a Default Dashboard

S3 Storage Lens includes an interactive dashboard which you can find in the S3 console. The dashboard gives you the ability to perform filtering and drill-down into your metrics to really understand how your storage is being used. The metrics are organized into categories like data protection and cost efficiency, to allow you to easily find relevant metrics.
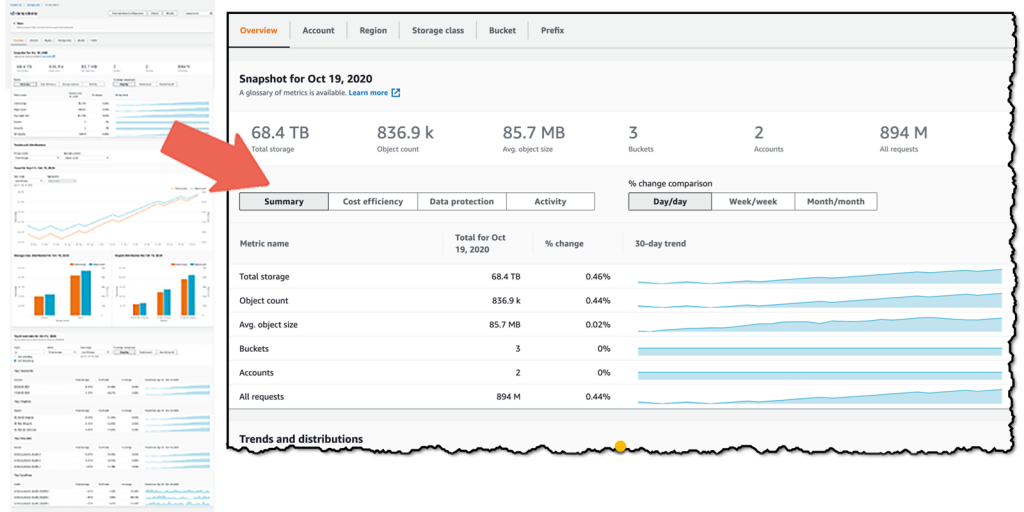
For ease of use all customers receive a default dashboard. If you are like many customers, this maybe the only dashboard that you need, but if you want to, you can make changes. For example, you could configure the dashboard to export the data daily to an S3 bucket for analysis with another tool (Amazon QuickSight, Amazon Athena, Amazon Redshift, etc.) or you could upgrade to receive advanced metrics and recommendations.

Creating a Dashboard
You can also create your own dashboards from scratch, to do this I head over to the S3 console and click on the Dashboards menu item inside the Storage Lens section. Secondly, I click the Create dashboard button.
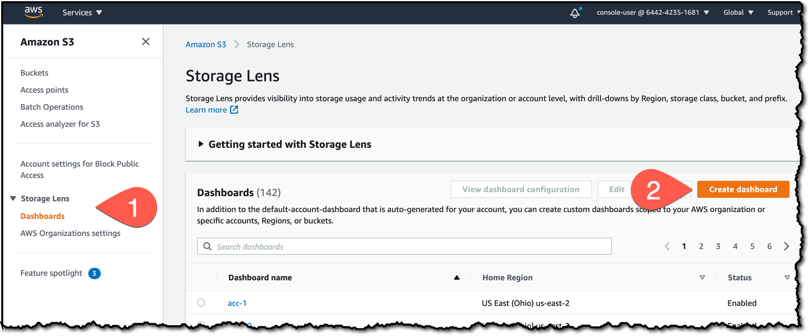
Screenshot of the console

I give my dashboard the name s3-lens-demo and select a home Region. The home Region is where the metrics data for your dashboard will be stored. I choose to enable the dashboard, meaning that it will be updated daily with new metrics.

A dashboard can analyze storage across accounts, Regions, buckets, and prefix. I choose to include buckets from all accounts in my organization and across all regions in the Dashboard scope section.

S3 Storage Lens has two tiers: Free Metrics, which is free of charge, automatically available for all S3 customers and contains 15 usage related metrics; and Advanced metrics and recommendations, which has an additional charge, but includes all 29 usage and activity metrics with 15-month data retention, and contextual recommendations. For this demo, I select Advanced metrics and recommendations.
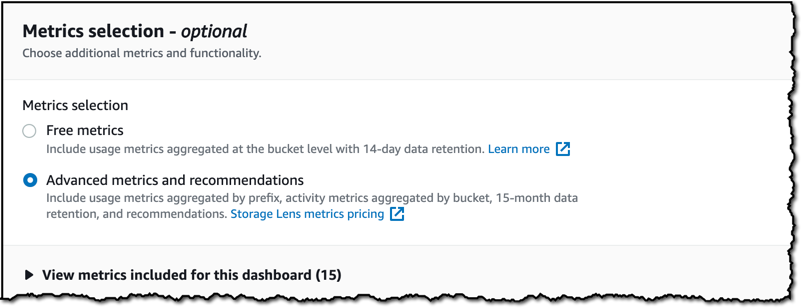
Screenshot of Management Console

Finally, I can configure the dashboard metrics to be exported daily to a specific S3 bucket. The metrics can be exported to either CSV or Apache Parquet format for further analysis outside of the console.
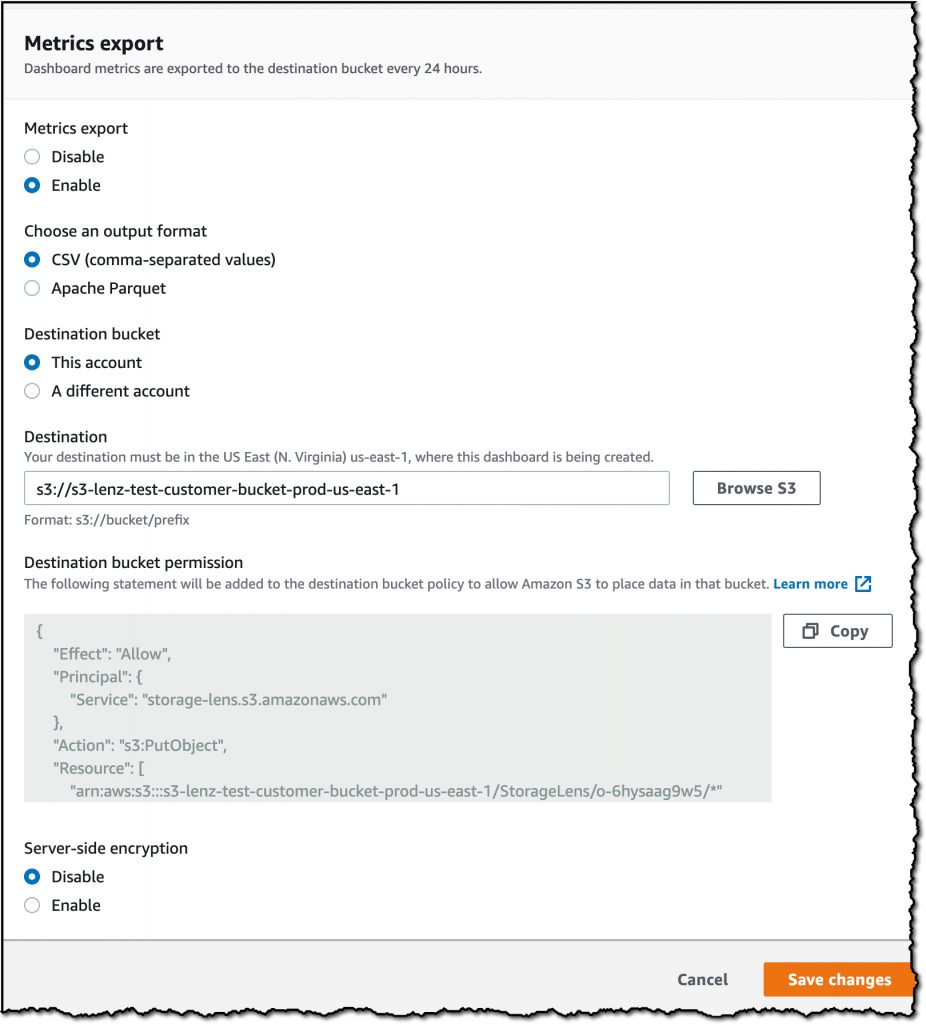
An alert pops up to tell me that my dashboard has been created, but it can take up to 48 hours to generate my initial metrics.

What does a Dashboard Show?

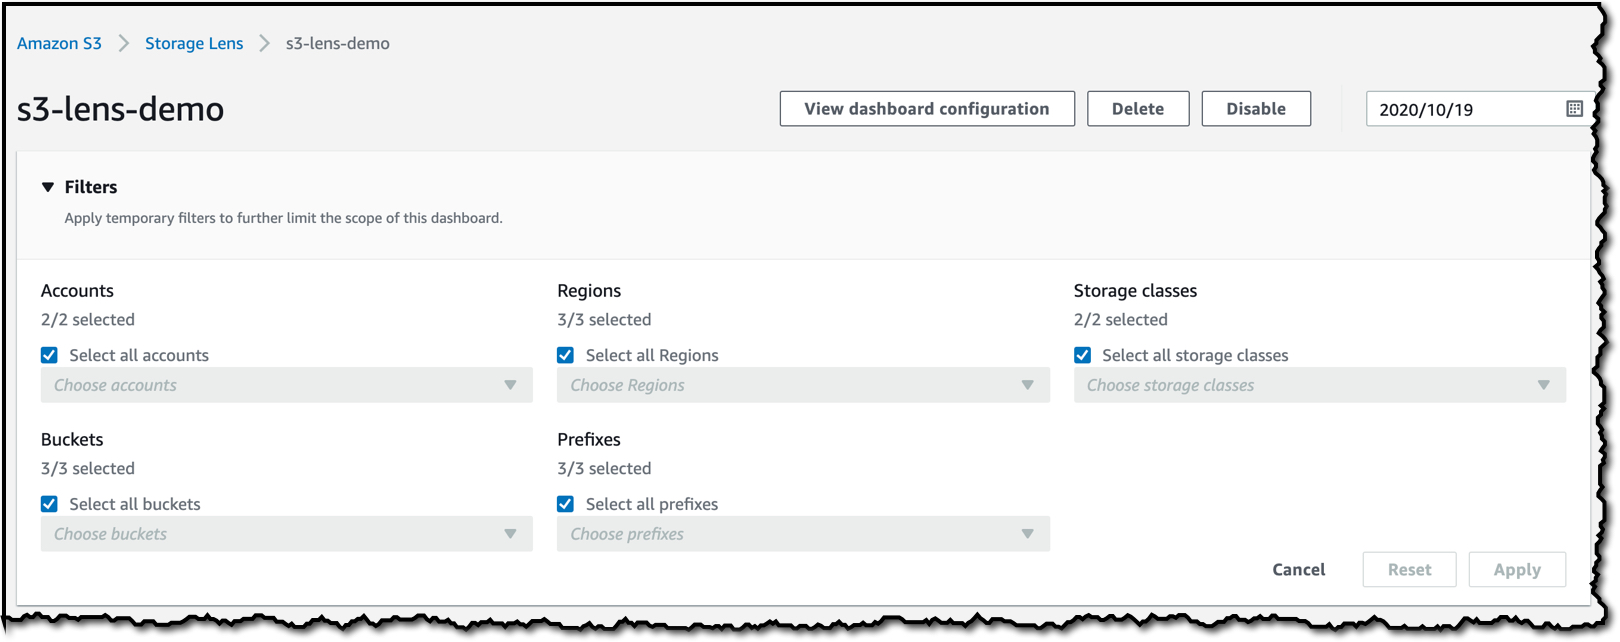
Once my dashboard has been created, I can start to explore the data. I can filter by Accounts, Regions, Storage classes, Buckets, and Prefixes at the top of the dashboard.
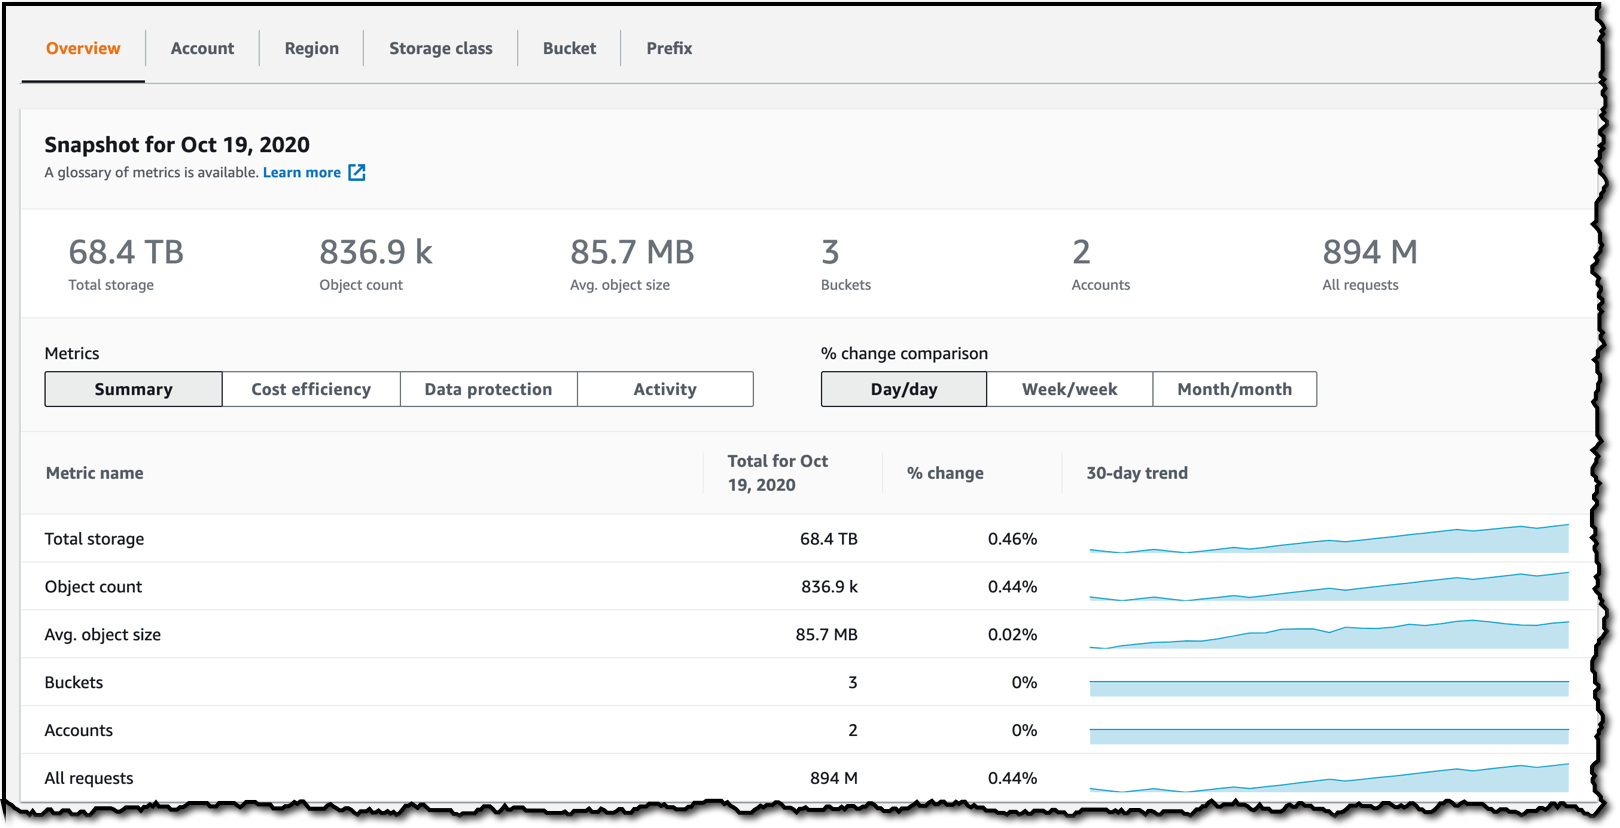
The next section is a snapshot of the metrics such as the Total storage and Object count, and I can see a trendline that shows the trend on each metric over the last 30 days and a percentage change. The number in the % change column shows by default the Day/day percentage change, but I can select to compare by Week/week or Month/month.

I can toggle between different Metric groups by selecting either Summary, Cost efficiency, Data protection, or Activity.

There are some metrics here that are pretty typical like total storage and object counts, and you can already receive these in a few places in the S3 console and in Amazon CloudWatch – but in S3 Storage Lens you can receive these metrics in aggregate across your organization or account, or at the prefix level, which was not previously possible.
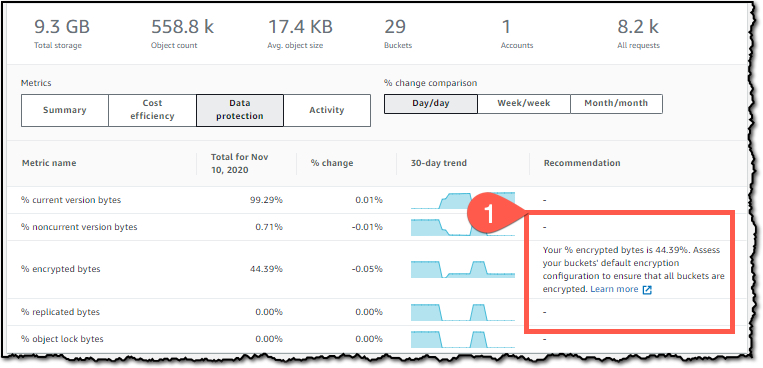
There are some other metrics you might not expect, like metrics that pertain to S3 feature utilization. For example we can break out the % of objects that are using encryption, or the number of objects that are non-current versions. These metrics help you understand how your storage is configured, and allows you to identify discrepancies, and then drill in for details.

The dashboard provides contextual recommendations alongside your metrics to indicate actions you can take based on the metric, for example ways to improve cost efficiency, or apply data protection best practices. Any recommendations are shown in the Recommendation column. A few days ago I took the screenshot below which shows a recommendation on one of my dashboards that suggests I should check my buckets’ default encryption configuration.
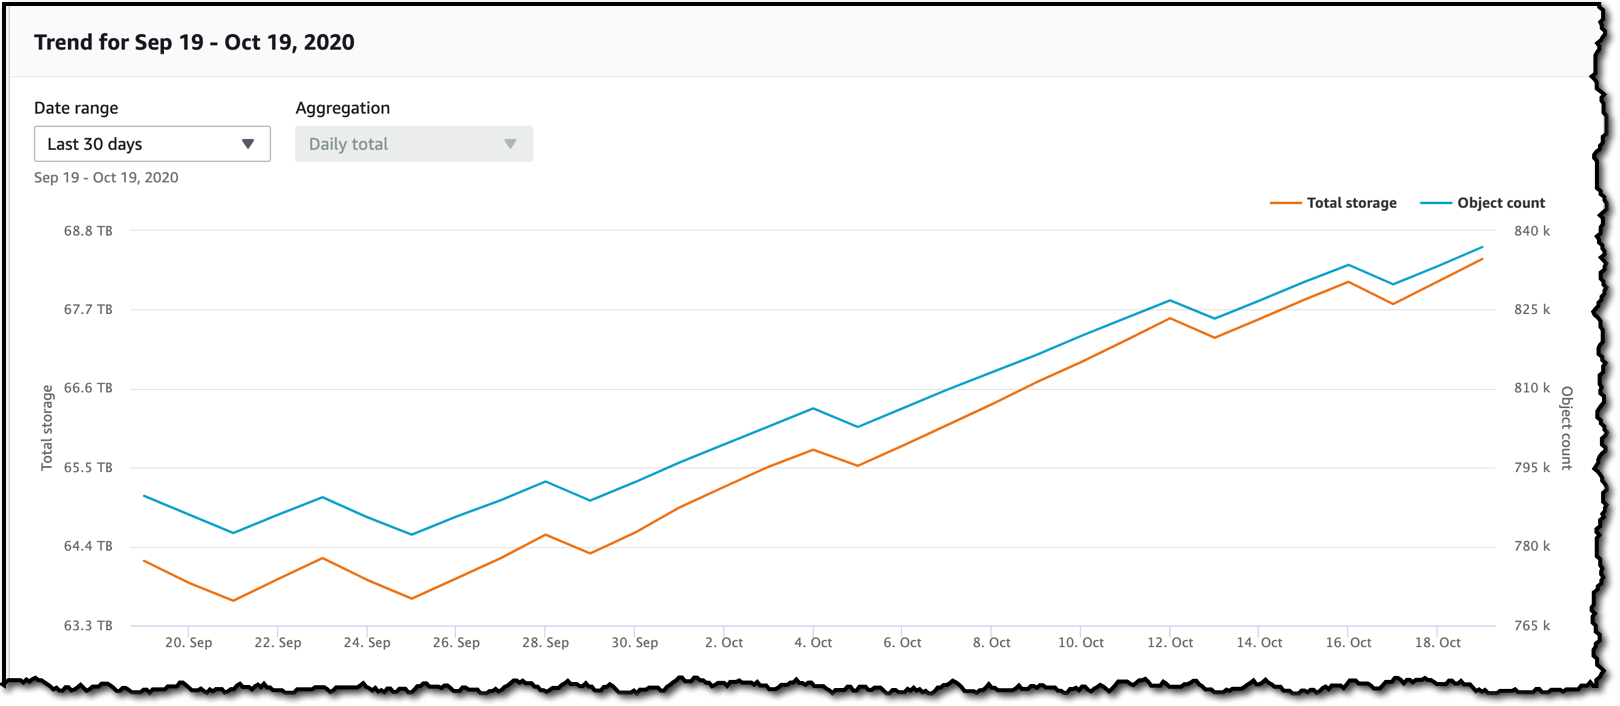
The dashboard trends and distribution section allows me to compare two metrics over time in more detail. Here I have selected Total storage as my Primary metric and Object Count as my Secondary metric.

These two metrics are now plotted on a graph, and I can select a date range to view the trend over time.
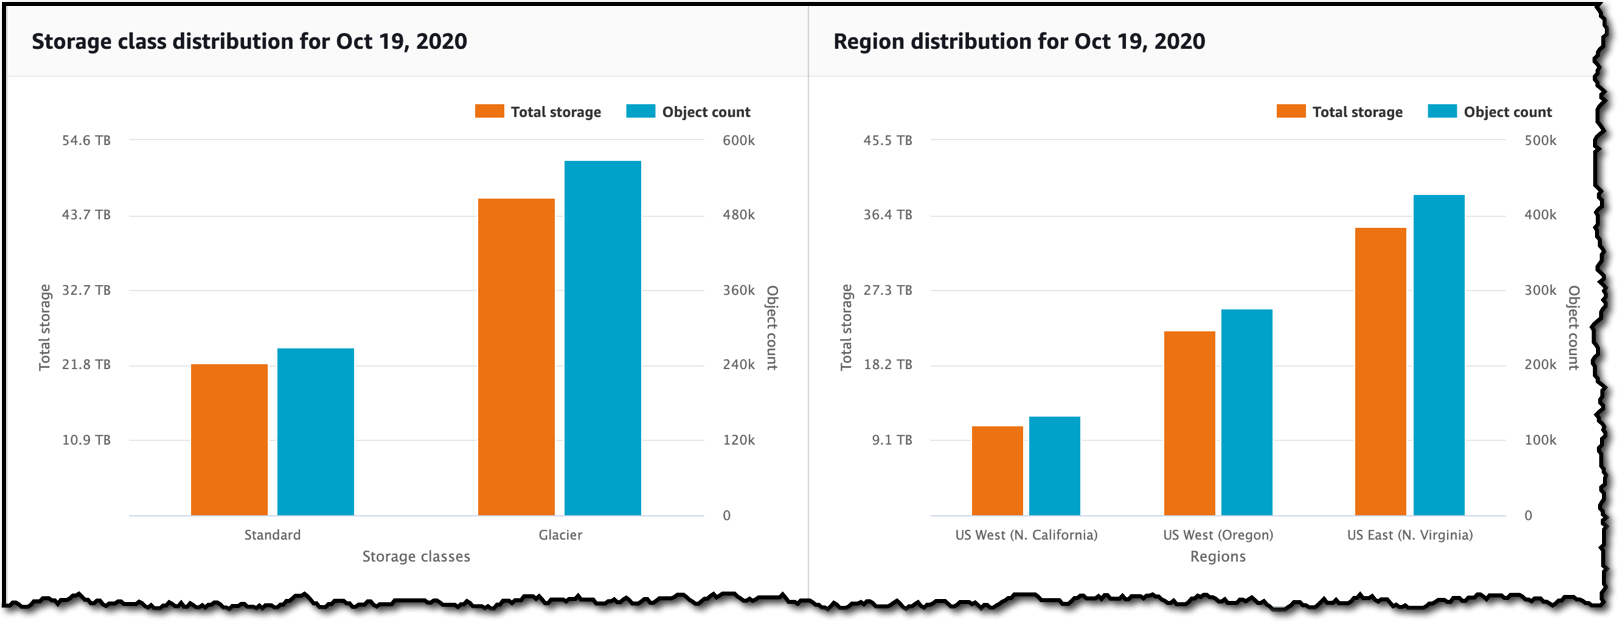
The dashboard also shows me those two metrics and how they are distributed across Storage class and Regions.
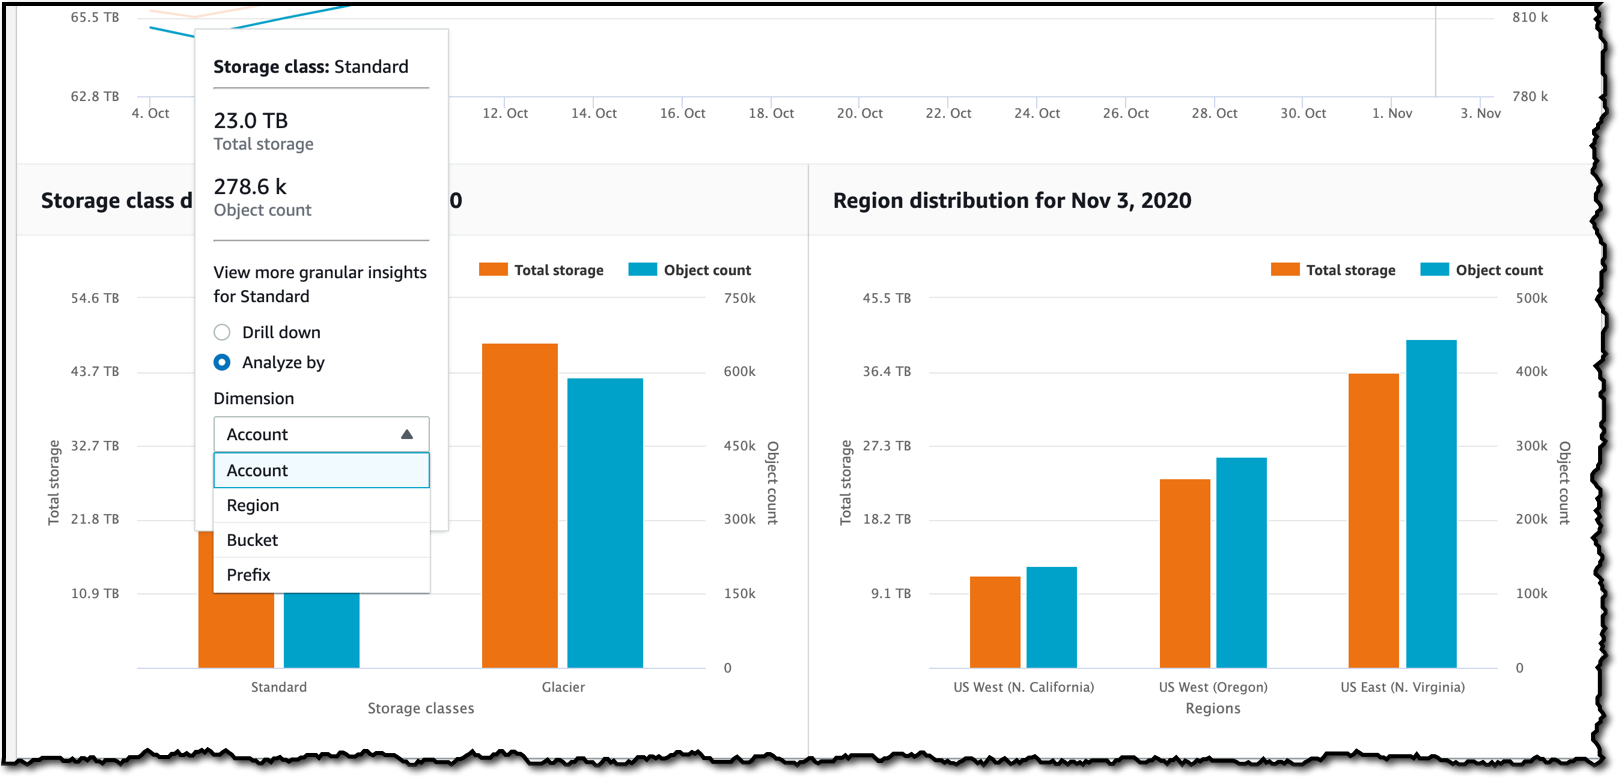
I can click on any value in this graph and Drill down to filter the entire dashboard on that value, or select Anayze by to navigate to a new dashboard view for that dimension.
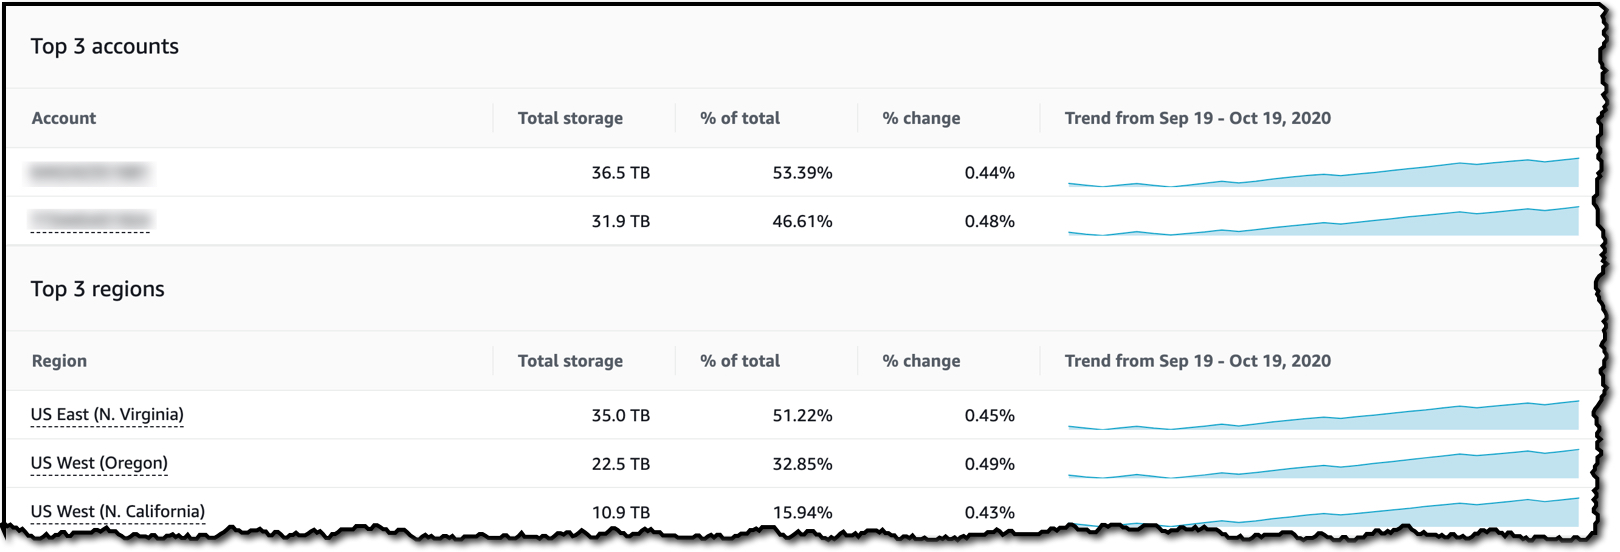
The last section of the dashboard allows me to perform a Top N analysis of a metric over a date range, where N is between 1 and 25. In the example below, I have selected the top 3 items in descending order for the Total storage metric.

I can then see the top three accounts (note: there are only two accounts in my organization) and the Total storage metric for each account.

It also shows the top 3 regions for the Total storage metric, and I can see that 51.15% of my data is stored in US East (N. Virginia)
Lastly, the dashboard contains information about the top 3 buckets and prefixes and the associated trends.
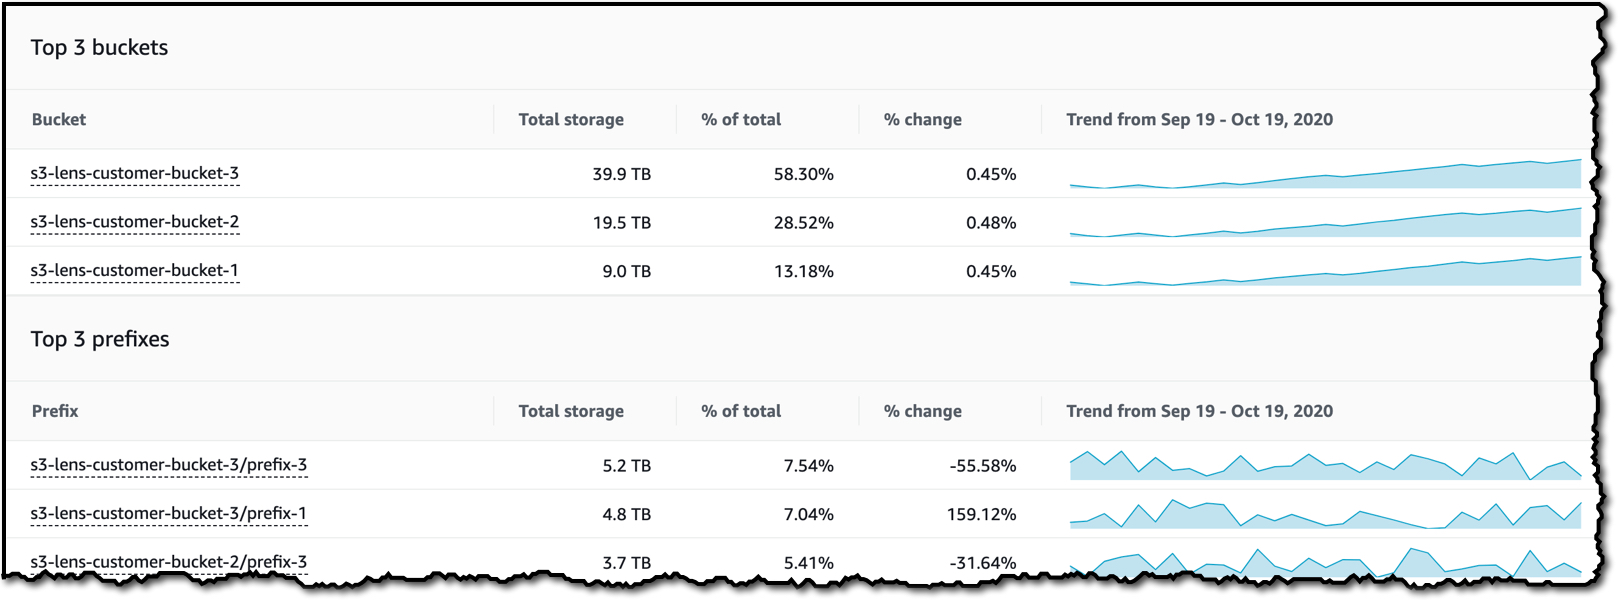
As I have shown, S3 Storage Lens delivers more than 29 individual metrics on S3 storage usage and activity for all accounts in your organization. These metrics are available in the S3 console to visualize storage usage and activity trends in a dashboard, with contextual recommendations that make it easy to take immediate action. In addition to the dashboard in the S3 console, you can export metrics in CSV or Parquet format to an S3 bucket of your choice for further analysis with other tools including Amazon QuickSight, Amazon Athena, or Amazon Redshift to name a few.

Video Walkthrough

If you would like a more indepth look at S3 Storage Lens the team have recorded the following video to explain how this new feature works.

Available Now

S3 Storage Lens is available in all commercial AWS Regions. You can use S3 Storage Lens with the Amazon S3 API, CLI, or in the S3 Console. For pricing information, regarding S3 Storage Lens advanced metrics and recommendations, check out the Amazon S3 pricing page. If you’d like to dive a little deeper, then you should check out the documentation or the S3 Storage Lens webpage.

Happy Storing

— Martin


Via AWS News Blog https://ift.tt/1EusYcK

Tuesday, November 17, 2020

AWS Network Firewall – New Managed Firewall Service in VPC

Our customers want to have a high availability, scalable firewall service to protect their virtual networks in the cloud. Security is the number one priority of AWS, which has provided various firewall capabilities on AWS that address specific security needs, like Security Groups to protect Amazon Elastic Compute Cloud (EC2) instances, Network ACLs to protect Amazon Virtual Private Cloud (VPC) subnets, AWS Web Application Firewall (WAF) to protect web applications running on Amazon CloudFront, Application Load Balancer (ALB) or Amazon API Gateway, and AWS Shield to protect against Distributed Denial of Service (DDoS) attacks.

We heard customers want an easier way to scale network security across all the resources in their workload, regardless of which AWS services they used. They also want customized protections to secure their unique workloads, or to comply with government mandates or commercial regulations. These customers need the ability to do things like URL filtering on outbound flows, pattern matching on packet data beyond IP/Port/Protocol and the ability to alert on specific vulnerabilities for protocols beyond HTTP/S.

Today, I am happy to announce AWS Network Firewall, a high availability, managed network firewall service for your virtual private cloud (VPC). It enables you to easily deploy and manage stateful inspection, intrusion prevention and detection, and web filtering to protect your virtual networks on AWS. Network Firewall automatically scales with your traffic, ensuring high availability with no additional customer investment in security infrastructure.

With AWS Network Firewall, you can implement customized rules to prevent your VPCs from accessing unauthorized domains, to block thousands of known-bad IP addresses, or identify malicious activity using signature-based detection. AWS Network Firewall makes firewall activity visible in real-time via CloudWatch metrics and offers increased visibility of network traffic by sending logs to S3, CloudWatch and Kinesis Firehose. Network Firewall is integrated with AWS Firewall Manager, giving customers who use AWS Organizations a single place to enable and monitor firewall activity across all your VPCs and AWS accounts. Network Firewall is interoperable with your existing security ecosystem, including AWS partners such as CrowdStrike, Palo Alto Networks, and Splunk. You can also import existing rules from community maintained Suricata rulesets.

Concepts of Network Firewall
AWS Network Firewall runs stateless and stateful traffic inspection rules engines. The engines use rules and other settings that you configure inside a firewall policy.

You use a firewall on a per-Availability Zone basis in your VPC. For each Availability Zone, you choose a subnet to host the firewall endpoint that filters your traffic. The firewall endpoint in an Availability Zone can protect all of the subnets inside the zone except for the one where it’s located.

You can manage AWS Network Firewall with the following central components.

  • Firewall – A firewall connects the VPC that you want to protect to the protection behavior that’s defined in a firewall policy. For each Availability Zone where you want protection, you provide Network Firewall with a public subnet that’s dedicated to the firewall endpoint. To use the firewall, you update the VPC route tables to send incoming and outgoing traffic through the firewall endpoints.
  • Firewall policy – A firewall policy defines the behavior of the firewall in a collection of stateless and stateful rule groups and other settings. You can associate each firewall with only one firewall policy, but you can use a firewall policy for more than one firewall.
  • Rule group – A rule group is a collection of stateless or stateful rules that define how to inspect and handle network traffic. Rules configuration includes 5-tuple and domain name filtering. You can also provide stateful rules using Suricata open source rule specification.

AWS Network Firewall – Getting Started
You can start AWS Network Firewall in AWS Management Console, AWS Command Line Interface (CLI), and AWS SDKs for creating and managing firewalls. In the navigation pane in VPC console, expand AWS Network Firewall and then choose Create firewall in Firewalls menu.

To create a new firewall, enter the name that you want to use to identify this firewall and select your VPC from the dropdown. For each availability zone (AZ) where you want to use AWS Network Firewall, create a public subnet to for the firewall endpoint. This subnet must have at least one IP address available and a non-zero capacity. Keep these firewall subnets reserved for use by Network Firewall.

For Associated firewall policy, select Create and associate an empty firewall policy and choose Create firewall.

Your new firewall is listed in the Firewalls page. The firewall has an empty firewall policy. In the next step, you’ll specify the firewall behavior in the policy. Select your newly created the firewall policy in Firewall policies menu.

You can create or add new stateless or stateful rule groups – zero or more collections of firewall rules, with priority settings that define their processing order within the policy, and stateless default action defines how Network Firewall handles a packet that doesn’t match any of the stateless rule groups.

For stateless default action, the firewall policy allows you to specify different default settings for full packets and for packet fragments. The action options are the same as for the stateless rules that you use in the firewall policy’s stateless rule groups.

You are required to specify one of the following options:

  • Allow – Discontinue all inspection of the packet and permit it to go to its intended destination.
  • Drop – Discontinue all inspection of the packet and block it from going to its intended destination.
  • Forward to stateful rule groups – Discontinue stateless inspection of the packet and forward it to the stateful rule engine for inspection.

Additionally, you can optionally specify a named custom action to apply. For this action, Network Firewall sends an CloudWatch metric dimension named CustomAction with a value specified by you. After you define a named custom action, you can use it by name in the same context where you have define it. You can reuse a custom action setting among the rules in a rule group and you can reuse a custom action setting between the two default stateless custom action settings for a firewall policy.

After you’ve defined your firewall policy, you can insert the firewall into your VPC traffic flow by updating the VPC route tables to include the firewall.

How to set up Rule Groups
You can create new stateless or stateful rule groups in Network Firewall rule groups menu, and choose Create rule group. If you select Stateful rule group, you can select one of three options: 1) 5-tuple format, specifying source IP, source port, destination IP, destination port, and protocol, and specify the action to take for matching traffic, 2) Domain list, specifying a list of domain names and the action to take for traffic that tries to access one of the domains, and 3) Suricata compatible IPS rules, providing advanced firewall rules using Suricata rule syntax.

Network Firewall supports the standard stateless “5 tuple” rule specification for network traffic inspection with priority number that indicates the processing order of the stateless rule within the rule group.

Similarly, a stateful 5 tuple rule has the following match settings. These specify what the Network Firewall stateful rules engine looks for in a packet. A packet must satisfy all match settings to be a match.

A rule group with domain names has the following match settings – Domain name, a list of strings specifying the domain names that you want to match, and Traffic direction, a direction of traffic flow to inspect. The following JSON shows an example rule definition for a domain name rule group.

{
  "RulesSource": {
    "RulesSourceList": {
      "TargetType": "FQDN_SNI","HTTP_HOST",
      "Targets": [
        "test.example.com",
        "test2.example.com"
      ],
      "GeneratedRulesType": "DENYLIST"
    }
  } 
}

A stateful rule group with Suricata compatible IPS rules has all settings defined within the Suricata compatible specification. For example, as following is to detect SSH protocol anomalies. For information about Suricata, see the Suricata website.

alert tcp any any -> any 22 (msg:"SURICATA TCP port 22 but not SSH"; app-layer-protocol:!ssh; sid:2271009; rev:1;)

You can monitor Network Firewall using CloudWatch, which collects raw data and processes it into readable, near real-time metrics, and AWS CloudTrail, a service that provides a record of API calls to AWS Network Firewall by a user, role, or an AWS service. CloudTrail captures all API calls for Network Firewall as events. To learn more about logging and monitoring, see the documentation.

Network Firewall Partners
At this launch, Network Firewall integrates with a collection of AWS partners. They provided us with lots of helpful feedback. Here are some of the blog posts that they wrote in order to share their experiences (I am updating this article with links as they are published).

Available Now
AWS Network Firewall is now available in US East (N. Virginia), US West (Oregon), and Europe (Ireland) Regions. Take a look at the product page, price, and the documentation to learn more. Give this a try, and please send us feedback either through your usual AWS Support contacts or the AWS forum for Amazon VPC.

Learn all the details about AWS Network Firewall and get started with the new feature today.

Channy;

Via AWS News Blog https://ift.tt/1EusYcK

The ‘intelligent edge’ isn’t always the smartest choice

The notion of the intelligent edge has been around for a few years. It refers to placing processing out on edge devices to avoid sending data all the way back to the centralized server, typically existing on public clouds.

While not always needed, the intelligent edge is able to leverage machine learning technology at the edge, moving knowledge building away from centralized processing and storage. Applications vary, from factory robotics to automobiles to on-premises edge systems residing in traditional data centers. It’s good in any situation where it makes sense to do the processing as close to the data source as you can get.

We’ve wrestled with this type of architectural problem for many years. With any distributed system, including cloud computing, you have to consider the trade-off of process and storage placement on different physical or virtual devices. The intelligent edge is no different.

To read this article in full, please click here

Friday, November 13, 2020

Lightsail Containers: An Easy Way to Run your Containers in the Cloud

When I am delivering an introduction to the AWS Cloud for developers, I usually spend a bit of time to mention and to demonstrate Amazon Lightsail. It is by far the easiest way to get started on AWS. It allows you to get your application running on your own virtual server in a matter of minutes. Today, we are adding the possibility to deploy your container-based workloads on Amazon Lightsail. You can now deploy your container images to the cloud with the same simplicity and the same bundled pricing Amazon Lightsail provides for your virtual servers.

Amazon Lightsail is an easy-to-use cloud service that offers you everything needed to deploy an application or website, for a cost effective and easy to understand monthly plan. It is ideal to deploy simple workloads, websites, or to get started with AWS. The typical Lightsail customers range from developers to small businesses or startups who are looking to get quickly started in the cloud and AWS. At any time, you can later adopt the broad AWS Services when you are getting more familiar with the AWS cloud.

Under the hood, Lightsail is powered by Amazon Elastic Compute Cloud (EC2), Amazon Relational Database Service (RDS), Application Load Balancer, and other AWS services. It offers the level of security, reliability, and scalability you are expecting from AWS.

When deploying to Lightsail, you can choose between six operating systems (4 Linux distributions, FreeBSD, or Windows), seven applications (such as WordPress, Drupal, Joomla, Plesk…), and seven stacks (such as Node.js, Lamp, GitLab, Django…). But what about Docker containers?

Starting today, Amazon Lightsail offers an simple way for developers to deploy their containers to the cloud. All you need to provide is a Docker image for your containers and we automatically containerize it for you. Amazon Lightsail gives you an HTTPS endpoint that is ready to serve your application running in the cloud container. It automatically sets up a load balanced TLS endpoint, and take care of the TLS certificate. It replaces unresponsive containers for you automatically, it assigns a DNS name to your endpoint, it maintains the old version till the new version is healthy and ready to go live, and more.

Let’s see how it works by deploying a simple Python web app as a container. I assume you have the AWS Command Line Interface (CLI) and Docker installed on your laptop. Python is not required, it will be installed in the container only.

I first create a Python REST API, using the Flask simple application framework. Any programming language and any framework that can run inside a container works too. I just choose Python and Flask because they are simple and elegant.

You can safely copy /paste the following commands:

mkdir helloworld-python
cd helloworld-python
# create a simple Flask application in helloworld.py
echo "

from flask import Flask, request
from flask_restful import Resource, Api

app = Flask(__name__)
api = Api(app)

class Greeting (Resource):
   def get(self):
      return { "message" : "Hello Flask API World!" }
api.add_resource(Greeting, '/') # Route_1

if __name__ == '__main__':
   app.run('0.0.0.0','8080')

"  > helloworld.py

Then I create a Dockerfile that contains the steps and information required to build the container image:

# create a Dockerfile
echo '
FROM python:3
ADD helloworld.py /
RUN pip install flask
RUN pip install flask_restful
EXPOSE 8080
CMD [ "python", "./helloworld.py"]
 '  > Dockerfile

Now I can build my container:

docker build -t lightsail-hello-world .

The build command outputs many lines while it builds the container, it eventually terminates with the following message (actual ID differs):

Successfully built 7848e055edff
Successfully tagged lightsail-hello-world:latest

I test the container by launching it on my laptop:

docker run -it --rm -p 8080:8080 lightsail-hello-world

and connect a browser to localhost:8080

Testing Flask API in the container

When I am satisfied with my app, I push the container to Docker Hub.

docker tag lightsail-hello-world sebsto/lightsail-hello-world
docker login
docker push sebsto/lightsail-hello-world

Now that I have a container ready on Docker Hub, let’s create a Lightsail Container Service.

I point my browser to the Amazon Lightsail console. I can see container services already deployed and I can manage them. To create a new service, I click Create container service:Lighsail Container Console

On the next screen, I select the size of the container I want to use, in terms of vCPU and memory available to my application. I also select the number of container instances I want to run in parallel for high availability or scalability reasons. I can change the number of container instances or their power (vCPU and RAM) at any time, without interrupting the service. Both these parameters impact the price AWS charges you per month. The price is indicated and dynamically adjusted on the screen, as shown on the following video.

Lightsail choose capacity

Slightly lower on the screen, I choose to skip the deployment for now. I give a name for the service (“hello-world“). I click Create container service.

Lightsail container name

Once the service is created, I click Create your first deployment to create a deployment. A deployment is a combination of a specific container image and version to be deployed on the service I just created.

I chose a name for my image and give the address of the image on Docker Hub, using the format user/<my container name>:tag. This is also where I have the possibility to enter environment variables, port mapping, or a launch command.

My container is offering a network service on port TCP 8080, so I add that port to the deployment configuration. The Open Ports configuration specifies which ports and protocols are open to other systems in my container’s network. Other containers or virtual machines can only connect to my container when the port is explicitly configured in the console or EXPOSE‘d in my Dockerfile. None of these ports are exposed to the public internet.

But in this example, I also want Lightsail to route the traffic from the public internet to this container. So, I add this container as an endpoint of the hello-world service I just created. The endpoint is automatically configured for TLS, there is no certificate to install or manage.

I can add up to 10 containers for one single deployment. When ready, I click Save and deploy.

Lightsail Deployment

After a while, my deployment is active and I can test the endpoint.

Lightsail Deployment Active

The endpoint DNS address is available on the top-right side of the console. If I must, I can configure my own DNS domain name.

Lightsail endpoint DNSI open another tab in my browser and point it at the https endpoint URL:

Testing Container DeploymentWhen I must deploy a new version, I use the console again to modify the deployment. I spare you the details of modifying the application code, build, and push a new version of the container. Let’s say I have my second container image version available under the name sebsto/lightsail-hello-world:v2. Back to Amazon Lightsail console, I click Deployments, then Modify your Deployments. I enter the full name, including the tag, of the new version of the container image and click Save and Deploy.

Lightsail Deploy updated VersionAfter a while, the new version is deployed and automatically activated.

Lightsail deployment sucesful

I open a new tab in my browser and I point it to the endpoint URI available on the top-right corner of Amazon Lightsail console. I observe the JSON version is different. It now has a version attribute with a value of 2.

lightsail v2 is deployed

When something goes wrong during my deployment, Amazon Lightsail automatically keeps the last deployment active, to avoid any service interruption. I can also manually activate a previous deployment version to reverse any undesired changes.

I just deployed my first container image from Docker Hub. I can also manage my services and deploy local container images from my laptop using the AWS Command Line Interface (CLI). To push container images to my Amazon Lightsail container service directly from my laptop, I must install the LightSail Controler Plugin. (TL;DR curl, cp and chmod are your friends here, I also maintain a DockerFile to use the CLI inside a container.)

To create, list, or delete a container service, I type:

aws lightsail create-container-service --service-name myservice --power nano --scale 1

aws lightsail get-container-services
{
   "containerServices": [{
      "containerServiceName": "myservice",
      "arn": "arn:aws:lightsail:us-west-2:012345678901:ContainerService/1b50c121-eac7-4ee2-9078-425b0665b3d7",
      "createdAt": "2020-07-31T09:36:48.226999998Z",
      "location": {
         "availabilityZone": "all",
         "regionName": "us-west-2"
      },
      "resourceType": "ContainerService",
      "power": "nano",
      "powerId": "",
      "state": "READY",
      "scale": 1,
      "privateDomainName": "",
      "isDisabled": false,
      "roleArn": ""
   }]
}

aws lightsail delete-container-service --service myservice

I can also use the CLI to deploy container images directly from my laptop. Be sure lightsailctl is installed.

# Build the new version of my image (v3)
docker build -t sebsto/lightsail-hello-world:v3 .

# Push the new image.
aws lightsail push-container-image --service-name hello-world --label hello-world --image sebsto/lightsail-hello-world:v3

After a while, I see the output:

Image "sebsto/lightsail-hello-world:v3" registered.
Refer to this image as ":hello-world.hello-world.1" in deployments.

I create a lc.json file to hold the details of the deployment configuration. it is aligned to the options I see on the console. I report the name given by the previous command on the image property:

{
  "serviceName": "hello-world",
  "containers": {
     "hello-world": {
        "image": ":hello-world.hello-world.1",
        "ports": {
           "8080": "HTTP"
        }
     }
  },
  "publicEndpoint": {
     "containerName": "hello-world",
     "containerPort": 8080
  }
}

Finally, I create a new service version with:
aws lightsail create-container-service-deployment --cli-input-json file://lc.json

I can query the deployment status with
aws lightsail get-container-services

...
"nextDeployment": {
   "version": 4,
   "state": "ACTIVATING",
   "containers": {
      "hello-world": {
      "image": ":hello-world.hello-world.1",
      "command": [],
      "environment": {},
      "ports": {
         "8080": "HTTP"
      }
     }
},
...

After a while, the status  becomes  ACTIVE, and I can test my endpoint.

curl https://hello-world.nxxxxxxxxxxx.lightsail.ec2.aws.dev/
{"message": "Hello Flask API World!", "version": 3}

If you plan to later deploy your container to Amazon ECS or Amazon Elastic Kubernetes Service, no changes are required. You can pull the container image from your repository, just like you do with Amazon Lightsail.

You can deploy your containers on Lightsail in all AWS Regions where Amazon Lightsail is available. As of today, this is US East (Ohio), US East (N. Virginia), US West (Oregon), Asia Pacific (Mumbai), Asia Pacific (Seoul), Asia Pacific (Singapore), Asia Pacific (Sydney), Asia Pacific (Tokyo), Canada (Central), Europe (Frankfurt), Europe (Ireland), Europe (London), and Europe (Paris).

As usual when using Amazon Lightsail, pricing is easy to understand and predictable. Amazon Lightsail Containers have a fixed price per month per container, depending on the size of the container (the vCPU/memory combination you use). You are charged on the prorated hours you keep the service running. The price per month is the maximum price you will be charged for running your service 24h/7. The prices are identical in all AWS Regions. They are ranging from $7 / month for a Nano container (512MB memory and 0.25 vCPU) to $160 / month for a X-Large container (8GB memory and 4 vCPU cores). This price not only includes the container itself, but also the load balancer, the DNS, and a generous data transfer tier. The details and prices for other AWS Regions are on the Lightsail pricing page.

I can’t wait to discover what solutions you will build and deploy on Amazon Lightsail Containers!

-- seb Via AWS News Blog https://ift.tt/1EusYcK

The ‘distributed cloud’ isn't emerging — it’s already here

According to Gartner, “Distributed cloud is the distribution of public cloud services to different physical locations, while the operation, governance and evolution of the services remain the responsibility of the public cloud provider.” Analysts go on to explain that the distributed cloud provides a flexible agile environment for applications and data that require low-latency, data cost reduction, and data residency.

This idea is not new; I’ve used it to remove latency and/or comply with data sovereignty laws from time to time. At its essence, the advantage is for end-users to have cloud computing resources closer to the physical location where the business activities happen, thus reducing latency.

To read this article in full, please click here